
Figure 7.
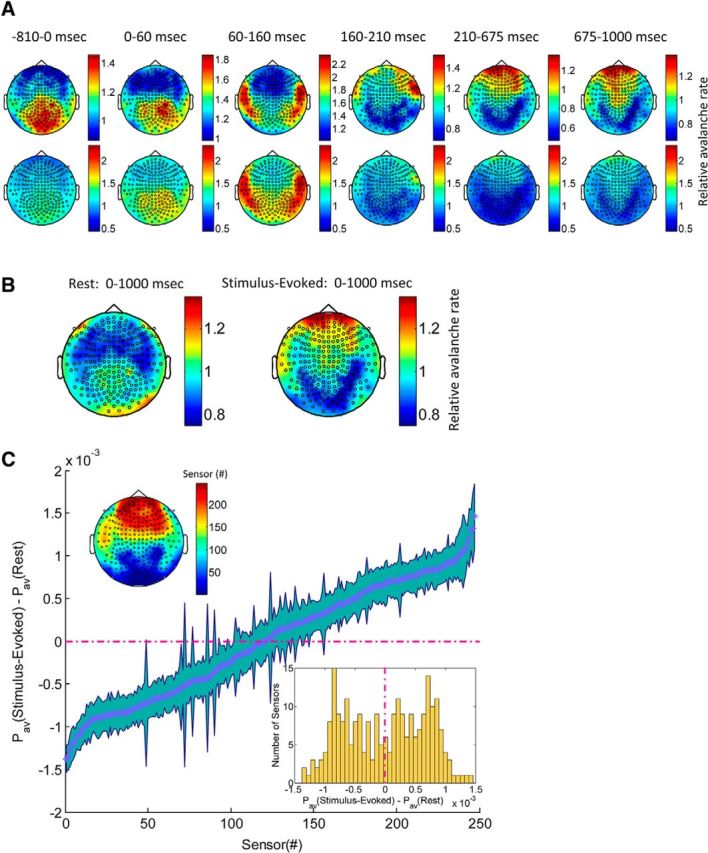
Spatial distribution of avalanches in stimulus-evoked and resting-state activity. A, Topography of relative avalanche rate for time-locked stimulus-evoked response (time interval of interest, as revealed by PSTH; Fig. 5A). Relative avalanche rate per sensor and time interval was calculated by dividing the rate at which a specific sensor participated in avalanches during the specific time interval by the mean avalanche rate across all sensors and all time intervals. Thus, relative avalanche rate of 1 indicates that the rate of the participation of a particular sensor in avalanches as the average. Color bars of top row are set by minimum–maximum values of a specific plot, whereas for the bottom row, the color bar was fixed (0.45, 2.35). B, Topography of relative avalanche rate for the 1 s stimulus-evoked (right) versus 1 s resting state (left). C, Differences in probability (±SEM) for a sensor to participate in any avalanche that concur during 1 s stimulus-evoked versus 1 s resting state. Thus, a negative probability (left side of the bimodal histogram located on the bottom right inset, bluish sensors in topography, top left inset) indicate higher probability for the specific sensor to participate in avalanches that occurred during resting-state versus stimulus-evoked activity. A clear spatial contiguity of topography is visible (top left inset, sensors are organized according to ascending order of the probability differences).