
Figure 5.
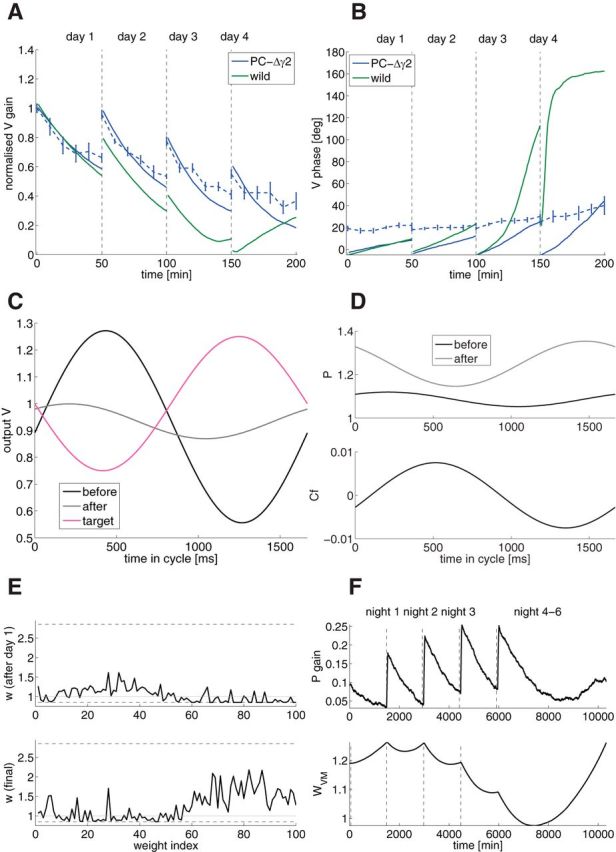
Inhibitory knock-out model (model of PC-Δγ2 mice; Wulff et al., 2009), learning the phase-reversal scenario. A, Gain as a function of training time (blue, PC-Δγ2; solid, model; dashed, experiments; green, wild-type model). B, Phase as a function of training time. C, Output V of PC-Δγ2 as a function of time in the cycle (black, initial value before learning; gray, final value after learning; magenta, target value). D, Top, PC SS activity P of PC-Δγ2 as a function of time in the cycle (black, initial value before learning; gray, after training). Bottom, CF of PC-Δγ2 as a function of time in the cycle in the dark. E, GC to PC weights of PC-Δγ2 as a function of weight index after the first day of training (top) and after the whole training (bottom). Dashed lines are the upper and lower bounds, the gray line is the initial weight. The weights are sorted by GC phase. F, Top, Gain evolution of PC as a signature of wPG plasticity across time. Bottom, wV M evolution.