
Figure 1.
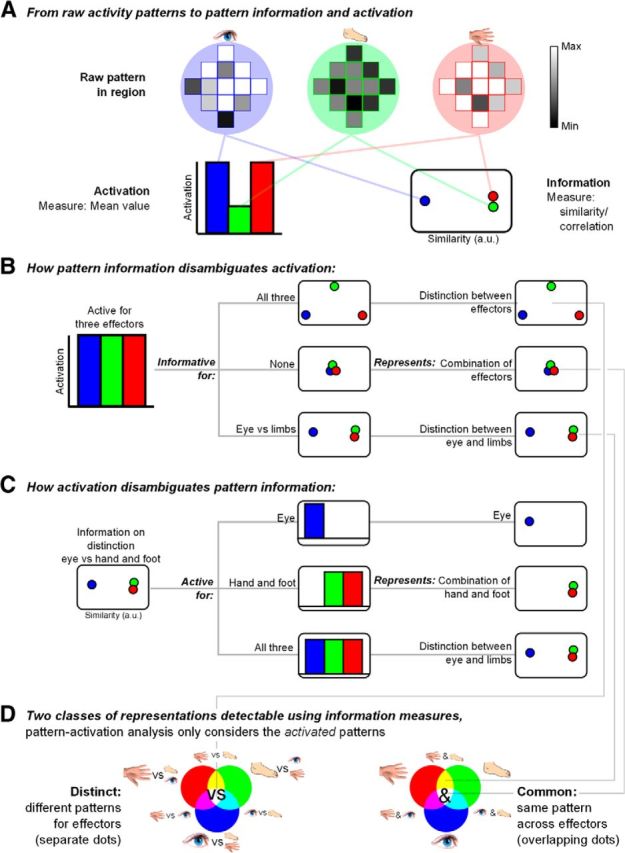
Study rationale. A, Preparing to move different effectors (eye, foot, and hand icons, represented in blue, green, and red colors, respectively) might evoke different spatial patterns and intensity of BOLD responses in a given cortical region (gray levels). Activation measures pertain to differences in mean activation (histogram of mean effector-related activities, on the left). Information measures capture the distance (correlation) between patterns of activation (plot of multidimensional scaling distances between effectors, MDS, on the right, with similarity in arbitrary units, a.u.). B, Example of how information measures can disambiguate activation. Given a region equally active for the three effectors (left histogram), information measures can follow three different patterns (middle column, MDS plots), reflecting three different representational contents (right column). C, Example of how activation measures can disambiguate information. Given a region with a pattern of eye-related responses different from hand- and foot-related responses (left, MDS plot), activation measures can follow three different patterns (middle column, histograms), reflecting three different representations (right column). D, Combining activation and information measures over three effectors results in 14 different types of representational content, as indicated by the corresponding icons and RGB combinations. These can be separated in a group pertaining to differences between effectors (“distinct,” on the left, meaning distinct patterns, or separate dots, for each effector), and a group pertaining to commonalities across effectors (“common,” on the right, meaning shared patterns, or overlapping dots, for the effectors). A given region can follow types from either group or, when complementary, both groups. Pattern-activation analysis only considers the activated patterns.