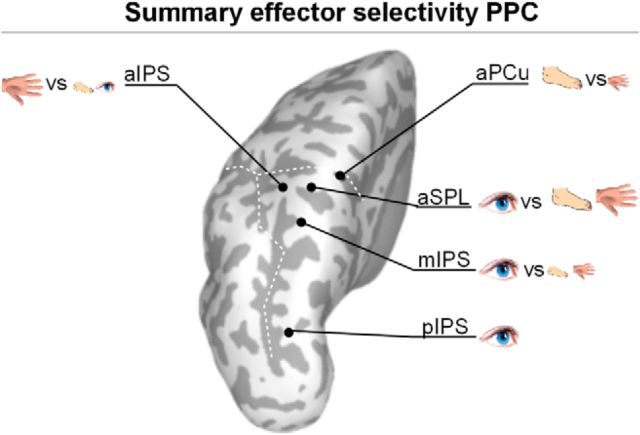
Figure 7.
Overview of the effector specificity results per ROI, combining the two pattern-activation plots (Fig. 3C). Black dots indicate the ROIs, the symbols indicate the different (vs) activated representations in these ROIs. Large symbols indicate the dominant (i.e., most activated) representations, small symbols the less activated representations.

