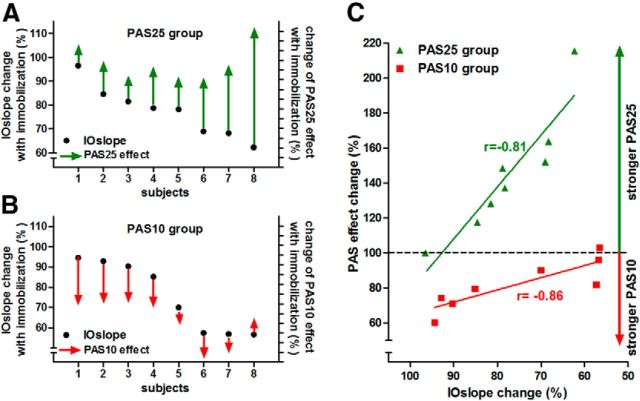
Figure 4.
Changes and correlations of IOslopes and PAS effects after immobilization in the individual subjects. A, B, Plot for each individual subject of the PAS25 (A) and PAS10 (B) groups the IOslope change (IOslope after immobilization: IOslope at baseline; percentage) on the left y-axis, as well as the change of the normalized PAS effect (PAS effect after immobilization: PAS effect at baseline; percentage) on the right y-axis, which displays the relative PAS effect change in percentage with ticks indicating steps of 10%. In both groups, the IOslope decreases after immobilization below the values measured at baseline (all black dots are <100%). However, the extent of the decrease varied in the individual subjects. The change in PAS effect is plotted as arrows going up (PAS25) or down (PAS10) to indicate the physiological direction of the PAS effects (LTP-like effect of PAS25; LTD-like effect of PAS10) which both show an increase after immobilization (note: subject 8 in the PAS10 group shows a decreased effect). In the PAS25 group, stronger decrease of the IOslope was associated with a stronger increase of the PAS25 effect after immobilization; whereas in the PAS10 group, stronger decrease of the IOslope was associated with a weaker increase of the PAS10 effect after immobilization (except subject 8 in the PAS10 group). C, The linear regression between the IOslope change (IOslope after immobilization: IOslope at baseline; percentage; x-axis) and the PAS effect change (PAS effect after immobilization: PAS effect at baseline; percentage; y-axis) for the PAS25 (green symbols) and PAS10 (red symbols) groups. In both groups, the immobilization-induced changes of IOslope and PAS effects are significantly correlated (PAS25 group: p < 0.002; PAS10 group: p < 0.013); Pearson's r is given in the figure.

