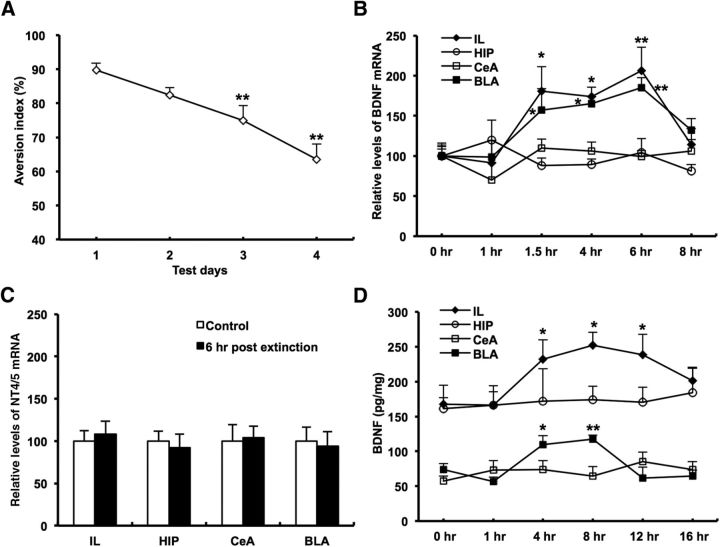
Figure 1.
Temporal and spatial regulation of BDNF expression during CTA extinction. A, The extinction curve of CTA in rats (n = 8 per extinction trial). **p < 0.01, versus the first extinction day (one-way ANOVA). B, Temporal and spatial changes of BDNF mRNA levels during CTA extinction using real-time PCR (n = 5 per time point). *p < 0.05, versus the values at 0 h time point (one-way ANOVA). **p < 0.01, versus the values at 0 h time point (one-way ANOVA). C, Levels of NT4/5 mRNA (n = 6 per group; one-way ANOVA) do not significantly change at 6 h after the second CTA extinction test in different brain regions. D, Temporal and spatial changes of BDNF protein levels during CTA extinction using ELISA. Rats were killed at 0, 1, 4, 8, 12, or 16 h after the second extinction test, and the BDNF protein levels in the IL, HIP, CeA, and BLA were measured (n = 5 or 6 per time point). *p < 0.05, versus the amount at 0 h time point (one-way ANOVA). **p < 0.01, versus the amount at 0 h time point (one-way ANOVA).

