
Figure 2.
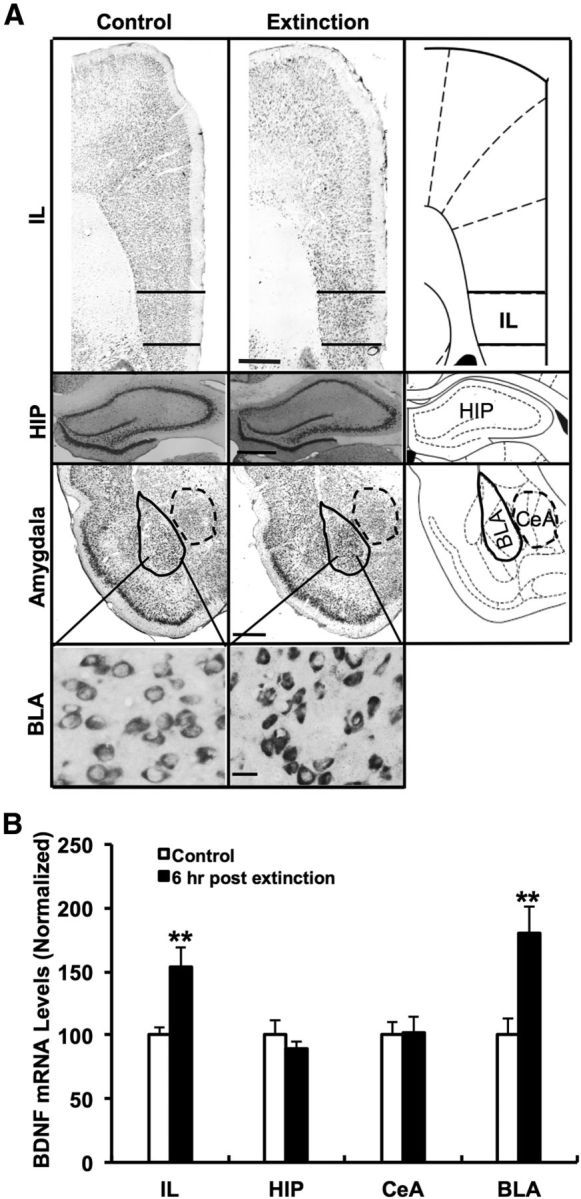
In situ hybridization analysis of regional selective BDNF mRNA changes at 6 h after the second CTA extinction test. A, Representative photomicrographs of coronal rat brain sections from control group or CTA extinction group depicting BDNF mRNA expression in the IL, HIP, CeA, and BLA. Scale bar, 500 μm. Magnification of sections containing the BLA from control and extinction group are presented at the bottom. Scale bar, 20 μm. B, Quantitative analysis of BDNF mRNA levels from in situ hybridization in the IL, HIP, CeA, and BLA at 6 h after the second CTA extinction test normalized to control (n = 5 per group). **p < 0.01 (t test).