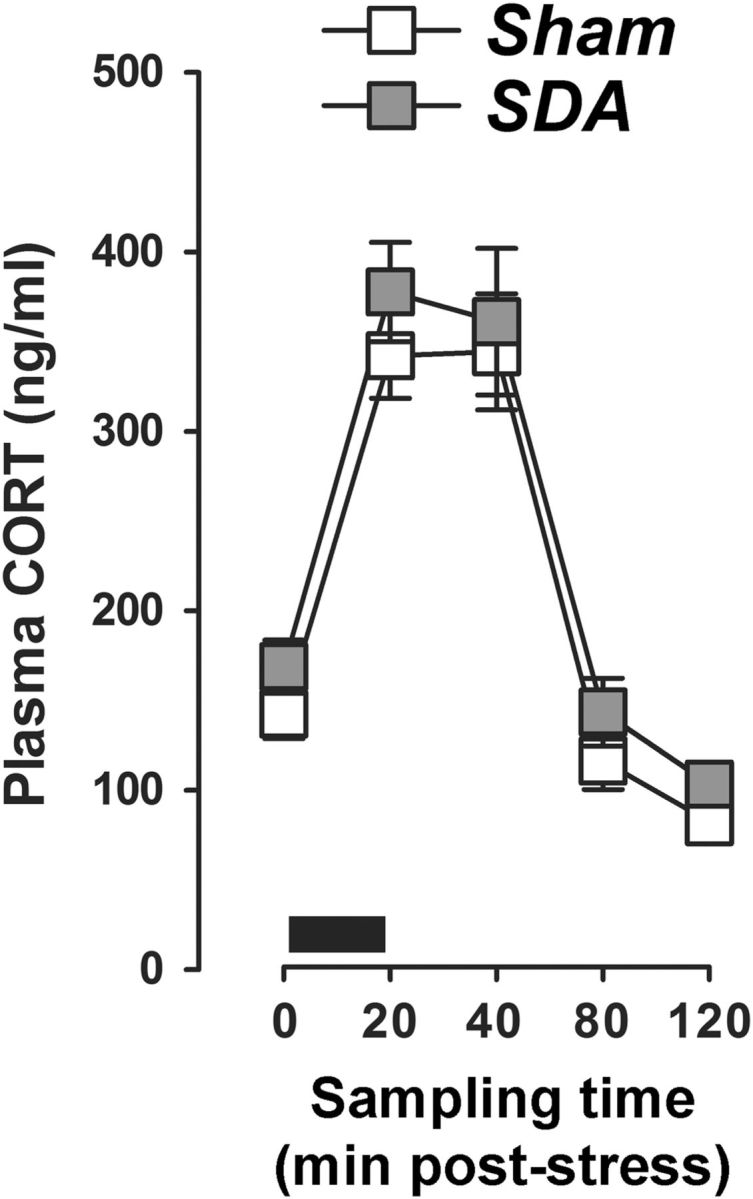
Figure 7.

SDA does not affect basal and stress-induced CORT secretion. The graph shows plasma CORT levels at basal conditions (sampling time 0) as well as 20, 40, 80, and 120 min after onset of stress exposure. Stress was applied in the form of restraint stress for 20 min (indicated by the black bar). N(Sham) = 10, N(SDA) = 11. All values are means ± SEM.
