
Figure 10.
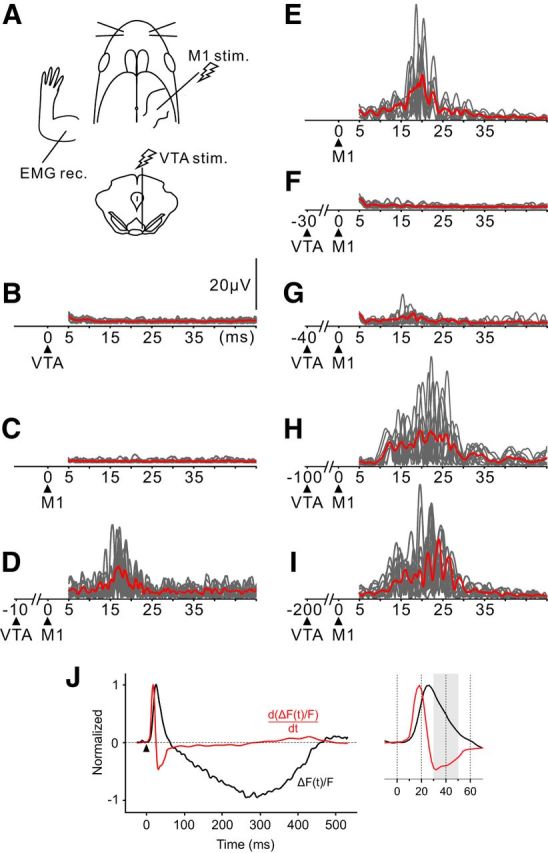
The ICMS-evoked EMG response is modulated depending on the timing of conditioning VTA stimulation. A, Schematic view of the experimental design. B, C, EMG of upper limb muscles in response to either VTA or M1 stimulation. Essentially no EMG response was observed after single-pulse stimulation to the VTA (B). Here the intensity of M1 stimulation was below the movement threshold (C). D, When the under-threshold M1 stimulation was conditioned with VTA stimulation, the EMG response was elicited. VTA stimulation preceded the ICMS by 10 ms. E, F, On the contrary, the ICMS-evoked EMG was abolished when paired with the 30 ms preceding VTA stimulation. The M1 stimulation with suprathreshold intensity evoked the EMG (E), but the muscle activity was precluded by the preceding VTA stimulation (F). G–I, The EMG response started to reappear when the interstimulus interval was set to 40 ms (G). As the interval increased, the EMG response recovered gradually and was restored by 200 ms (H, I). Gray lines indicate the EMG traces in each trial, and a red line indicates the mean EMG activity. Black triangles represent the stimulus onset. J, A possible explanation for the time-dependent suppression of EMG. Traces represent the time course of the VTA-evoked optical signal (black, the same trace as in Fig. 1C) and its time derivative (red). The magnified inset on the right represents the initial phase. Differential operations were applied to the smoothened optical signal. The period during which the time derivative signal showed a large negative value (30–50 ms after stimulation, shaded in gray) coincided with the period of strong EMG suppression (F, G).