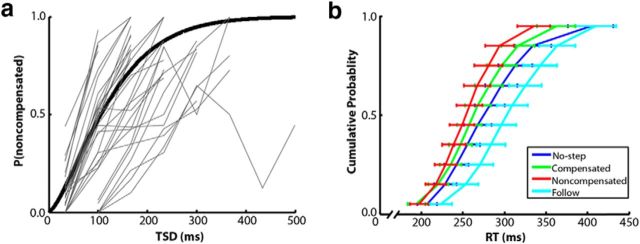
Figure 3.
Search-step task performance. Compensation functions are depicted in a for all participants (light gray) and averaged across the group (black). Compensation functions plot the proportion of redirect trials in which the participant failed to compensate as a function of the TSD. A cumulative Weibull distribution was fit to the group data. Vincentized RT distributions for no-step trials (blue), compensated (relative to T2 onset; green), noncompensated trials (red), and the first saccade of follow trials (cyan) are plotted in b. For each subject, RTs for each of the four trial types were binned into deciles. Decile means were averaged across subjects to create the group-averaged RT distributions. Error bars indicate SEM.

