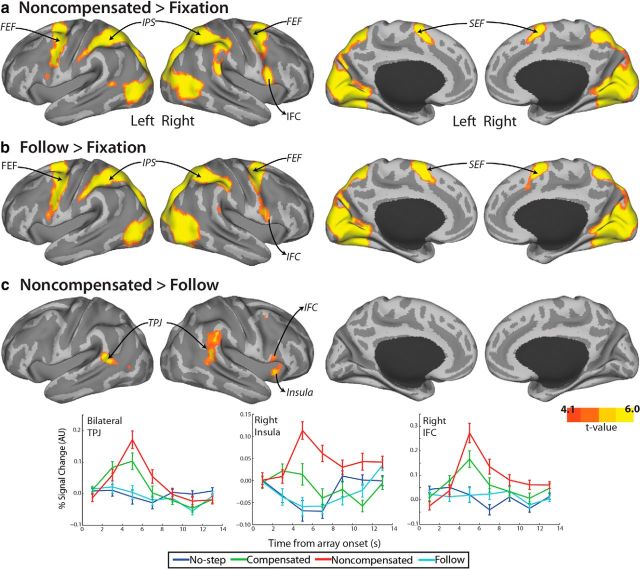
Figure 8.
BOLD activation that is greater for noncompensated than follow trials. Cortical activation that is greater for noncompensated trials versus fixation (a), follow trials versus fixation (b), and noncompensated versus follow trials (c) was rendered onto an MNI-normalized inflated surface. Activation is displayed at an uncorrected p < 0.0001. Clusters that met significance at an FWE-corrected p < 0.05 are displayed in Table 1. Group event-related time courses (bottom) were calculated for each trial type within a 3 mm sphere centered on the maximally activated voxel in TPJ, right insula, and right IFC. For TPJ, time courses were averaged across right and left hemispheres. Error bars indicate SEM.

