Figure 5.
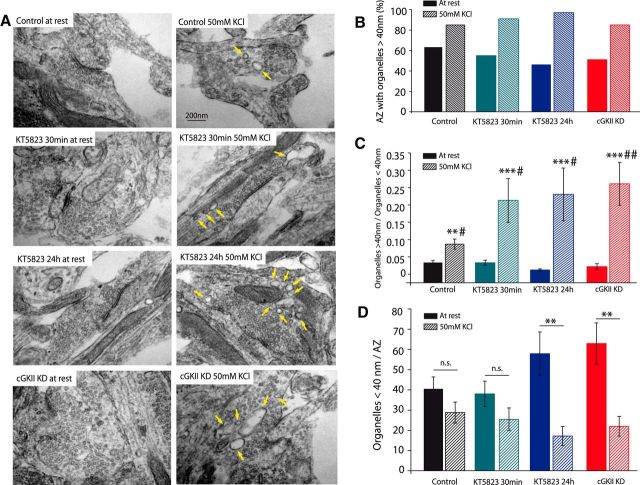
cGKII KD or inhibition increased the presence of endosomal-like structures under strong and sustained stimulation. In electron microscopy experiments, cells were stimulated (50 mm KCl, 3 min) to mimic the FM1-43 loading step or they were maintained at rest. A, Electron micrographs of cerebellar granule cells at rest (left) or after stimulation (right). B, Distribution of AZs (in percentages) with organelles >40 nm (endosomal-like structures) at rest or after stimulation in cells under different experimental conditions. C, The ratio of organelles >40 nm/organelles <40 nm at rest or after stimulation in cells under different experimental conditions: #represents significance of each condition with respect to the control, and *represents the significance between the basal and stimulated cells in each condition. Data are mean ± SEM of control AZs (at rest, n = 22), stimulated control AZs (n = 27, *p = 0.0223, Mann–Whitney), KT 30 min AZs at rest (n = 43), KT 30 min stimulated AZs (n = 55, *p < 0.0001, #p = 0.0162, Mann–Whitney), KT 24 h AZs at rest (n = 26), KT 24 h stimulated AZs (n = 38, *p < 0.0001, #p = 0.0321, Mann–Whitney), cGKII KD AZs at rest (n = 31), and cGKII KD-stimulated AZs (n = 27, *p < 0.0001, #p = 0.0077, Mann–Whitney). D, sSVs/AZ in AZs with an organelles >40 nm/organelles <40 nm ratio above the average value: *represents the significance between the basal and stimulated cells in each condition. At rest: n = 10, control; n = 12, KT 30 min; n = 10, KT 24 h; n = 10, cGKII KD. Stimulated: n = 9, control (p = 0.12, Mann–Whitney); n = 12, KT 30 min (p = 0.09, Mann–Whitney); n = 6, KT 24 h (p = 0.004, Mann–Whitney); and n = 8, cGKII KD (p = 0.0029, Mann–Whitney).

