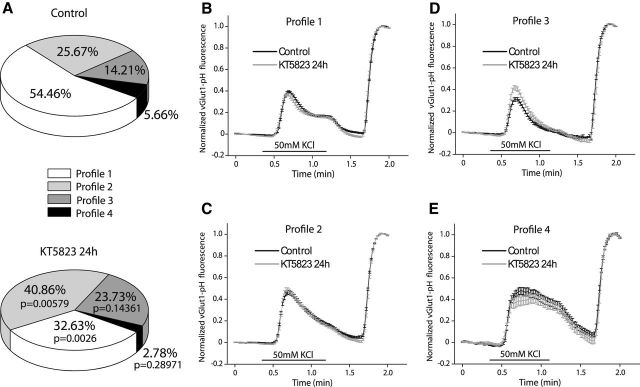
Figure 8.
Heterogeneous profiles for vGlut1-pHluorin fluorescence recovery after strong and sustained stimulation (50 s, 50 mm KCl) in control cells and those exposed to KT5823 for 24 h. A, Proportions of the four types of profiles found in control (n = 10 coverslips from 4 cultures) and KT5823-treated cells (n = 8 coverslips from 4 cultures). B, Profile 1: mean traces of KCl-elicited vGlut1-pHluorin fluorescence normalized to NH4Cl-elicited fluorescence in control (N = 222 boutons) and KT5823-treated neurons (N = 134 boutons). C, Profile 2: mean traces of KCl-elicited vGlut1-pHluorin fluorescence normalized to NH4Cl-elicited fluorescence in control (N = 116 boutons) and KT5823-treated neurons (N = 168 boutons). D, Profile 3: mean traces of KCl-elicited vGlut1-pHluorin fluorescence normalized to NH4Cl-elicited fluorescence in control (N = 60 boutons) and KT5823-treated neurons (N = 96 boutons). E, Profile 4: mean traces of KCl-elicited vGlut1-pHluorin fluorescence normalized to NH4Cl-elicited fluorescence in control (N = 21 boutons) and KT5823-treated neurons (N = 14 boutons).

