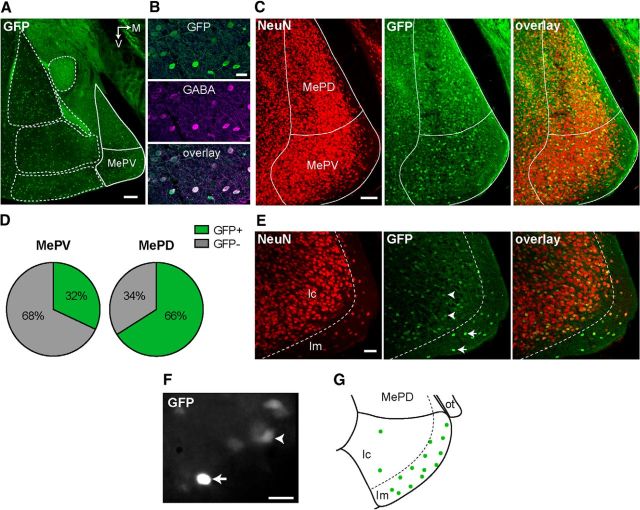
Figure 1.
The majority of MePV neurons are non-GABAergic. A, Coronal section containing the amygdala from a GAD67-GFP transgenic mouse showing the distribution of GFP-expressing neurons. Dashed lines indicate the boundaries of major amygdala nuclei. Solid lines indicate MeA borders. B, GFP+ cells are GABAergic. Photomicrographs of MePV neurons show GFP expression (top), immunoreactivity to GABA antibody (middle), and their colocalization (bottom). C, D, Distribution of GFP+ cells in the posteroventral (MePV) and posterodorsal (MePD) medial amygdala. C, Photomicrographs represent NeuN-ir cells (left), GFP expression (middle), and their colocalization (right) in the MePV and MePD. There is a higher number of GFP− neurons in the MePV (red only). D, Pie charts represent the proportion of GFP+ and GFP− neuronal populations in the posterior MeA. E, MePV can be divided into a cell-sparse molecular layer (lm) and a cell-rich cellular layer (lc). Photomicrographs represent NeuN-ir neurons in the MePV (left), GFP expression (middle), and their colocalization (right). A cell-sparse region is evident in the ventral region of the MePV (lm), which contains a population of GFP+ cells with distinctively bright fluorescence (middle, arrows). GFP fluorescence of lc neurons was comparatively weak (middle, arrowheads). F, Bright GFP+ cells could be identified in acute slices. A GFP+ cell of the lm/lc border (arrow) has markedly brighter fluorescence than the neighboring cells (arrowhead). G, Schematic map of the locations of bright GFP+ cells from which recordings were made. Most of these cells were located in the molecular layer, with a few scattered in the cellular layer. M, Medial; ot, optic tract; V, ventral. Scale bars: A, 200 μm; C, 100 μm; E, 50 μm; B, F, 20 μm.

