Figure 10.
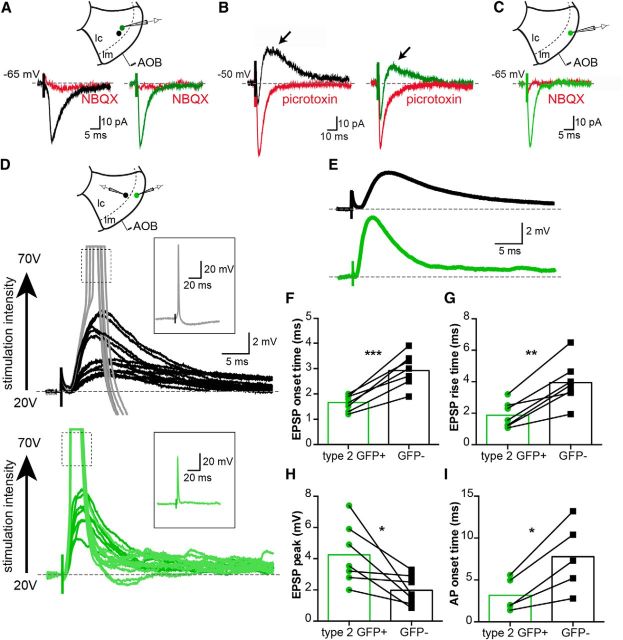
Type 2 GABAergic cells provide feedforward inhibition in the olfactory circuitry of the MePV. A, Projection neurons in the MePV receive synaptic input from the AOB. Recordings were made from GFP+ (Types 1 and 3) and GFP− (Types I and II) neurons in the cellular layer (lc). Stimulation of AOB afferents evoked EPSCs in all types of electrophysiologically identified neurons. Traces are EPSCs recorded in a Type I GFP− (black trace, left) and a Type 1 GFP+ cell (green trace, right) at −65 mV holding potential. EPSCs were blocked by the AMPA/kainate receptor antagonist NBQX (10 μm). B, A delayed IPSC was evoked in both GFP− and GFP+ neurons in response to stimulation of AOB afferents. Traces represent averaged AOB-evoked postsynaptic currents in a Type I GFP− (left, black) and a Type 1 GFP+ cell (right, green) held at −50 mV. Disynaptic IPSCs were blocked by picrotoxin (100 μm) (red traces). C, Type 2 GFP+ cells also receive direct olfactory input from AOB afferents. AOB stimulation evoked a monosynaptic EPSC (green) that was blocked by NBQX (10 μm) (red). D, Subthreshold and suprathreshold AOB-evoked responses in Type 2 GFP+ cells precede those in GFP− neurons. Paired recordings were made from a Type 2 GFP+ (green) and a GFP− cell (either Type I or Type II, black), and AOB afferents stimulated electrically (schematic). Subthreshold EPSPs were evoked with lower stimulation intensities (20–50 V) (black and dark green traces), whereas stronger stimulations (60–70 V) evoked suprathreshold responses with superimposed APs (gray and light green traces, insets). AOB-evoked APs in Type 2 cell preceded those in the GFP− cell. E, Mean subthreshold EPSPs from the pair of cells shown in D. AOB-evoked postsynaptic responses in the two neurons had distinct kinetics. F–I, Summary data from all recorded pairs. AOB-evoked EPSPs in Type 2 cells (green) had a faster onset time (F), rise time (10%–90% peak amplitude, G), and a larger peak amplitude (H). Moreover, AOB-evoked APs first appeared in Type 2 cells (I). *p < 0.05 (paired Student's t test). **p < 0.01 (paired Student's t test). ***p < 0.001 (paired Student's t test).

