
Figure 4.
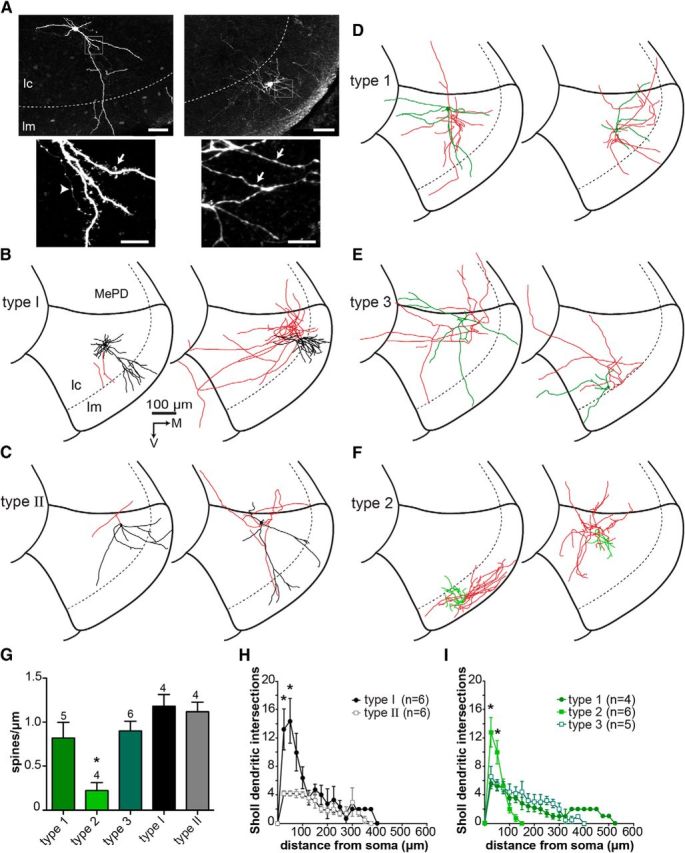
Morphological properties of MePV neurons. A, Biocytin-filled MePV neurons that were visualized using streptavidin-conjugated fluorescent dyes. Representative Type 1 (left) and Type 2 (right) GFP+ cells are shown. High-magnification photomicrographs (insets) show spiny dendrites of Type 1 (bottom left, arrow), and smooth beaded dendrites of Type 2 cell (bottom right, arrows). Axons were differentiated from dendrites based on their thin diameter and the presence of “en-passant” boutons (bottom left, arrowhead). Representative reconstructed morphologies: B, Type I GFP− cells; C, Type II GFP− cells; D, Type 1 GFP+ cells; E, Type 3 GFP+ cells; F, Type 2 GFP+ cells. Soma and dendrites are in black (GFP− cells) or green (GFP+ cells), and axons in red. G, Dendritic spine density of electrophysiologically identified cell types. Spines were counted over a 50 μm length of the dendrite and within 30–50 μm from the soma. Spine density was calculated as the number of spines per 1 μm. Type 2 GFP+ cells had significantly lower spine density than other MePV neurons. Bars represent mean ± SEM. Numbers on top of bars are the number of cells in each group. H, I, Graphs represent dendritic complexities of GFP− and GFP+ cells, respectively. Sholl analysis was performed (see Materials and Methods), and number of dendritic intersections (mean ± SEM) at each Sholl circle was plotted against the distance from the soma. H, Type I GFP− cells had a more complex dendritic arborization compared with Type II cells (see also B, C). I, Type 2 GFP+ cells had a compact dendritic tree, with more branching than Type 1 and Type 3 cells (see also F). M, Medial; V, ventral. *p < 0.05 (one-way ANOVA with Bonferroni post hoc test). Scale bars: A, 50 μm; A, insets, 10 μm.