
Figure 6.
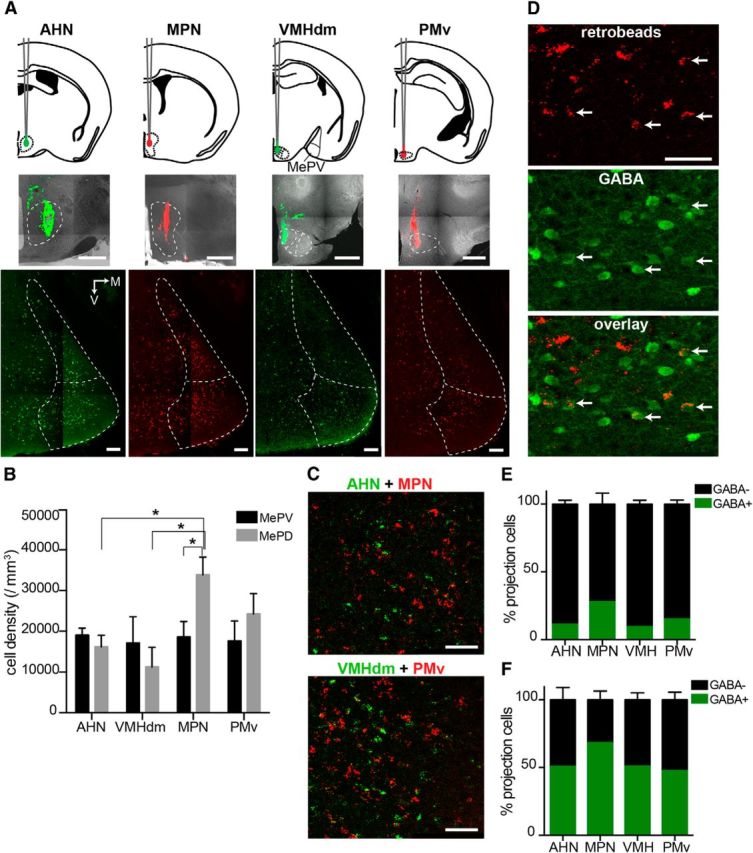
Both GABAergic and non-GABAergic cells project to the hypothalamus. A, MeA cells projecting to reproductive or defensive hypothalamic nuclei are found in both divisions of the posterior MeA. Retrograde tracers (retrobeads, 0.2–0.3 μl) were injected into AHN, MPN, VMHdm, and PMv (top and middle). Red and green tracers were used in two different regions in the same animal (AHN and MPN, or VMHdm and PMv). Photomicrographs of the MeA (bottom) show that, for all injections, retrogradely labeled cells were found in both MePV and MePD. B, Graph represents the density of retrogradely labeled cells from each region. No difference was found in the number of retrogradely labeled MePV neurons from different hypothalamic regions, whereas MePD neurons preferentially projected to the MPN. C, MePV neurons projecting to different hypothalamic nuclei were largely nonoverlapping. Photomicrographs represent retrogradely labeled neurons in the MePV from AHN (red) and MPN (green) dual injections (top), and VMHdm (red) and PMv (green) dual injections (bottom). Neurons projecting to different regions were intermingled but largely nonoverlapping. D, Some MePV projection neurons are GABAergic. Photomicrographs represent AHN-projecting MePV neurons retrogradely labeled with a tracer in AHN (top), GABA-ir cells labeled with immunohistochemistry (middle), and their colocalization (bottom). Some GABAergic neurons were labeled with the tracer, showing that there are projection cells (arrows). E, F, Distribution of GABAergic and non-GABAergic projection neurons in the MePV (E) and MePD (F). A total of 10%–30% of hypothalamus-projecting MePV neurons were GABA-ir (E). GABAergic cells in the MePD accounted for the majority of projection neurons (>50%, F). M, Medial; V, ventral. Graph bars represent mean ± SEM. *p < 0.05 with two-way ANOVA and Bonferroni post hoc test. Scale bars: A, middle, 500 μm; A, bottom, 100 μm; B, C, 50 μm.