
Figure 5.
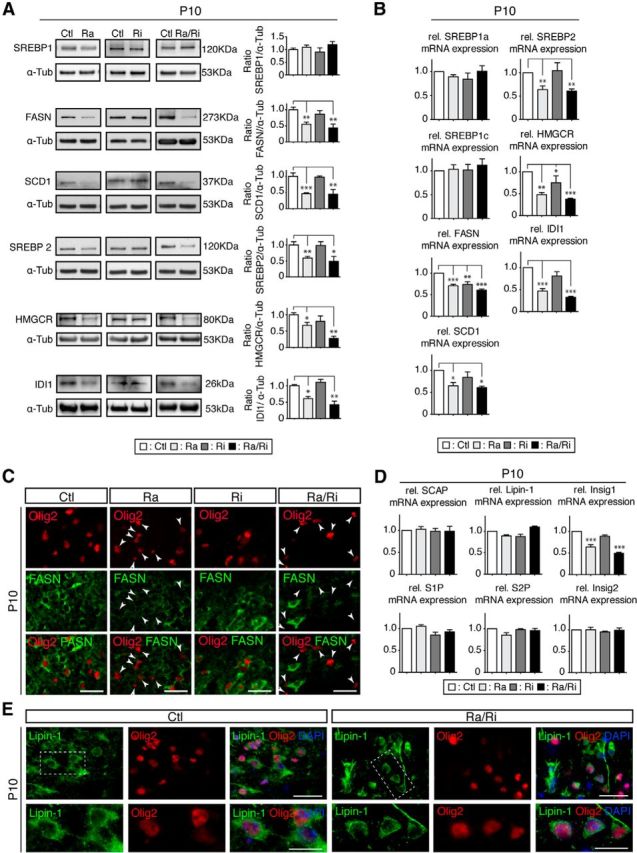
mTORC1 regulates lipogenesis via SREBP transcription factors. A, Western blot analysis of protein levels of SREBPs and their main targets in raptor, rictor, and raptor/rictor mutants. SREBP1 protein levels showed no change, whereas while its targets, FASN and SCD1, were reduced in raptor and raptor/rictor mutants. The same mutants showed a reduction at the protein level for SREBP2 and its targets HMGCR and IDI1. B, qRT-PCR of SREBPS and their main targets. C, Transverse sections of spinal cords revealed reduced staining for FASN (green) in oligodendrocyte lineage cells (Olig2+, red) in raptor and raptor/rictor mutants. Arrowheads indicate cells positive for Olig2 and negative for FASN. Scale bars, 25 μm. Error bars indicate SEM. n = 3; *p < 0.05; **p < 0.01; ***p < 0.001. D, Quantification of mRNA levels of key elements responsible for the maturation of the SREBPs did not display significant changes compared with controls, except for Insig1, a target of SREBPs, in raptor and raptor/rictor mutants. E, Transverse sections of spinal cords double-labeled for Lipin-1 (green) and the oligodendrocyte lineage marker Olig2 (red) shows no detectable nuclear localization of Lipin-1 in raptor/rictor mutants and no difference in the subcellular localization of Lipin-1 compared with controls. Scale bars, 50 μm.