
Figure 9.
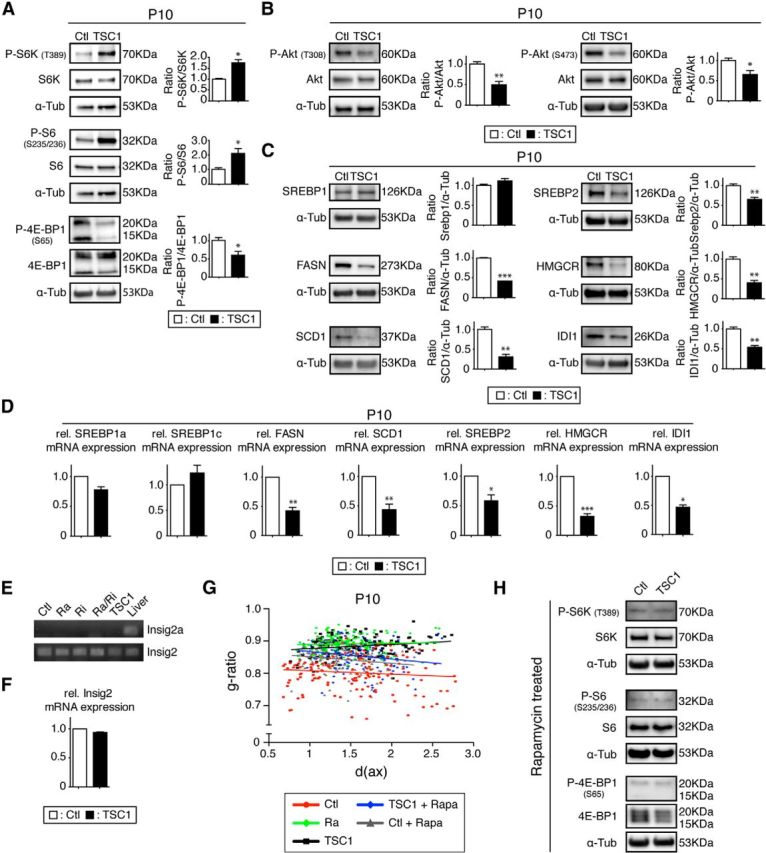
TSC1 mutant analysis. A, Phosphorylation levels of mTORC1 downstream targets P-S6K (T389) and P-S6K (S235/236) were strongly upregulated, except for P-4E-BP1 (S65), which was reduced. B, Phosphorylation of Akt was decreased on both T308 and S473. C, As in the raptor mutants, protein levels of main targets of SREBP and SREBP2 itself were reduced in mutants. D, qRT-PCR of the SREBPs and their main targets. E, RT-PCR for Insig2a and Insig2 in raptor, rictor, raptor/rictor, TSC1 mutant, and control spinal cords compared with liver positive control (ethidium-bromide-stained agarose gel). F, qRT-PCR of Insig2 in TSC1 mutants and control spinal cords. Error bars indicate SEM. n = 3; *p < 0.05; **p < 0.01; ***p < 0.001. G, Scatter plot graphics of g-ratios versus diameter of axons (in micrometers) of animal treated with rapamycin from P3 to P10. Shown are controls (gray triangles) and TSC1 mutants (blue diamonds) compared with control animals (red circles), raptor mutants (green diamonds), and TSC1 mutants (black squares) without treatment. Error bars indicate SEM. n = 3; *p < 0.05; **p < 0.01; ***p < 0.001. H, Spinal cord samples of rapamycin-treated TSC1 mutants and littermate controls showed the same downregulation of the main mTORC1 downstream targets.