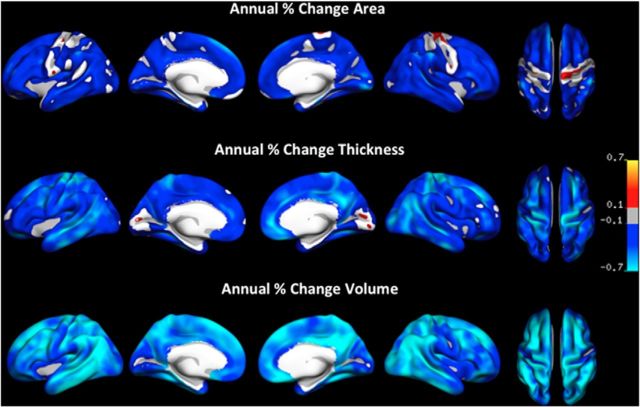
Figure 2.
Annual percentage change in cortical area, thickness, and volume, shown on the same scale to highlight variations in change magnitude across the three measures. Only effects that survived FDR correction for multiple comparisons at the 0.05 level are displayed. Blue-cyan reflects decreases in area/thickness/volume and red-yellow reflects increases.

