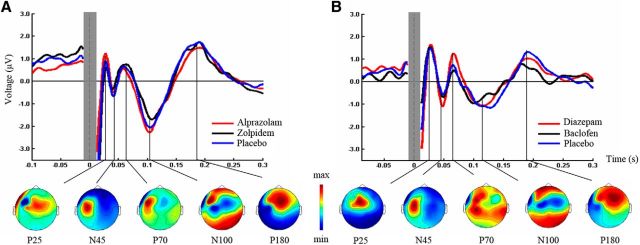
Figure 3.
TEPs before drug intake. Grand-average TEPs (over all electrodes and artifact-free trials) induced by left M1 TMS before intake of alprazolam (red), zolpidem (black), or placebo (blue) (Experiment 1, A), and diazepam (red), baclofen (black), or placebo (blue) (Experiment 2, B). The time of TMS equals 0 ms. The shaded gray bar represents the part of the EEG trace (±10 ms) that was linearly interpolated to remove the TMS-induced artifact. TEP components are labeled according to their polarity and approximate latency. Bottom line indicates topographical distributions of surface voltages for the most pronounced TEP components (P25, N45, P70, N100, P180; grand-average across predrug measurements in the three drug conditions) for Experiment 1 (A) and Experiment 2 (B). Maps are scaled and color-coded individually according to their respective maximum (red) and minimum (blue).

