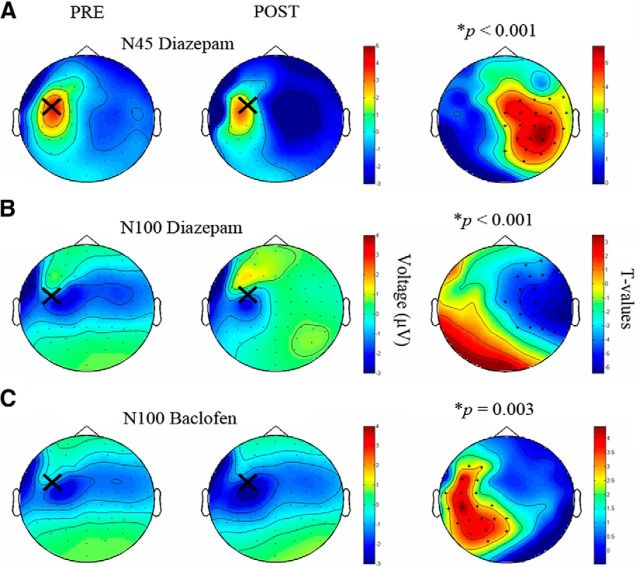
Figure 7.
Topographical plots for TEP components N45 and N100 after intake of baclofen and diazepam (Experiment 2). Topographical distributions of the TEP amplitudes (color coded in μV) before (PRE, left column) and after (POST, middle column) diazepam (A, N45; B, N100) and baclofen (C, N100). Large crosses indicate site of TMS of the hand area of left-hemispheric M1. Right column, t-statistic maps of the TEP amplitude postdrug versus predrug differences. Crosses indicate significant channels, predominantly in the nonstimulated right hemisphere for diazepam, and in the stimulated left hemisphere for baclofen. Red represents increase in negativity; blue represents decrease in negativity. For further details, see Material and Methods.

