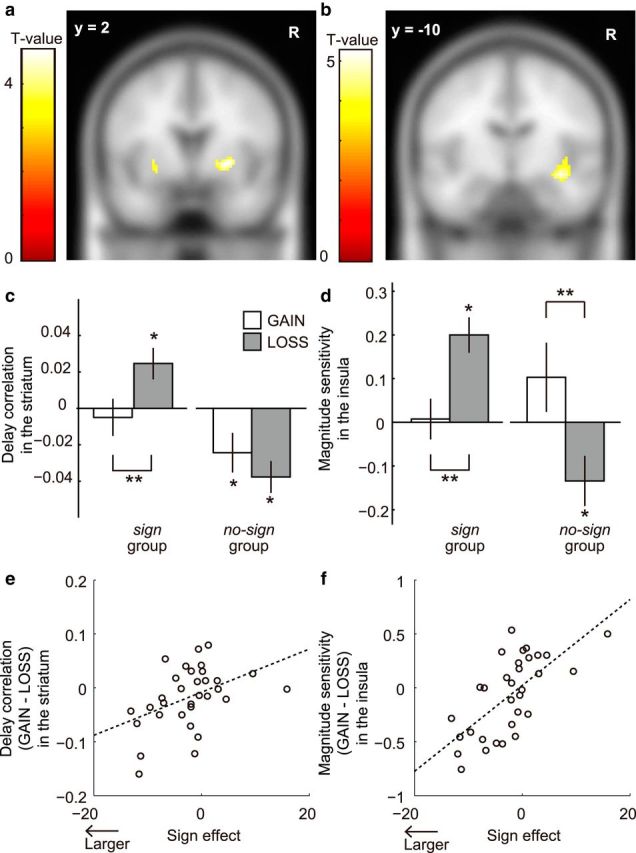
Figure 3.

a, In the striatum, we found a significant difference between the sign and no-sign groups in the LOSS condition in terms of the correlation between BOLD signals and delay length. b, In the insula, we found a significant group difference in the LOSS condition in terms of magnitude sensitivity. c, Delay correlation in the striatum in the GAIN (white bars) and LOSS (gray bars) conditions. d, Magnitude sensitivity in the insula in the GAIN (white bars) and LOSS (gray bars) conditions (sign: n = 23; no-sign: n = 9). **p < 0.05 (multiple comparison with Tukey–Kramer method). *p < 0.05 (one-sample t test). e, Differences between the behaviorally measured discount rates in the GAIN and LOSS conditions and between the striatal delay correlations in the GAIN and LOSS conditions were significantly correlated (r = 0.437, p < 0.05). f, Differences between the behaviorally measured discount rates in the GAIN and LOSS conditions and between the left insular magnitude sensitivity in the GAIN and LOSS conditions were significantly correlated (r = 0. 673, p < 0.05). Error bars indicate SE.
