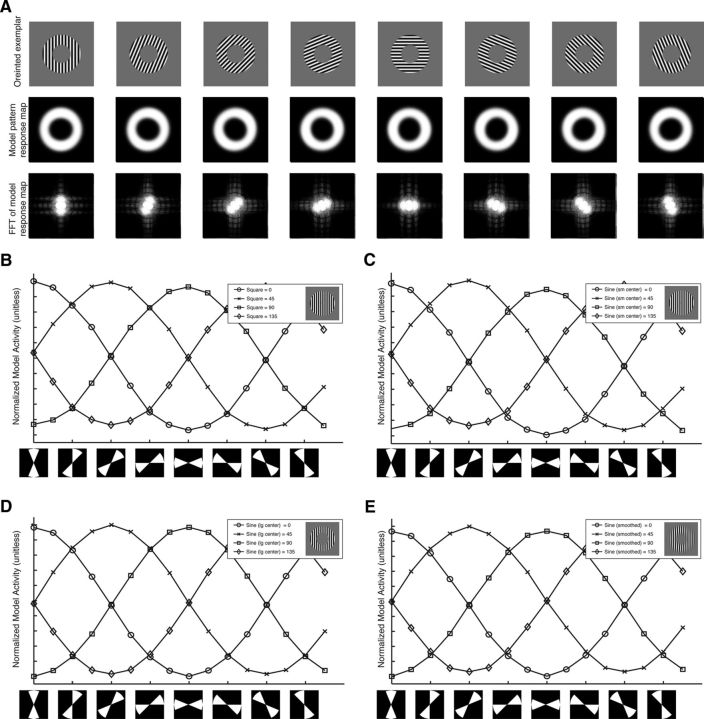
Figure 4.
Model activity mimics a radial bias. A, Top, Orientation exemplars from the sine-wave stimulus set with a large inner edge radius. Middle, PCM's pattern response. Bottom, Log amplitude of the 2D Fourier analysis on the model response. Spatial frequency is lowest in the center of the image and increases from the center. The highlighted central region indicates frequencies below the Nyquist sampling rate. B–E, PCM activity as a function of polar angle. The x-axis is a double wedge region of the PCM's pattern response (diagrammatically shown below the axis). The wedge has a width of 45° and its angular position shifts stepwise in 22.5° steps. The y-axis is the mean PCM activation within the defined region. The lines are different stimulus orientations. B, Square-wave grating with a small inner radius edge. C, Sine-wave grating with a small inner radius edge. D, Sine-wave grating with a large inner radius edge. E, Sine-wave grating with a small inner radius edge and heavy blur function.

