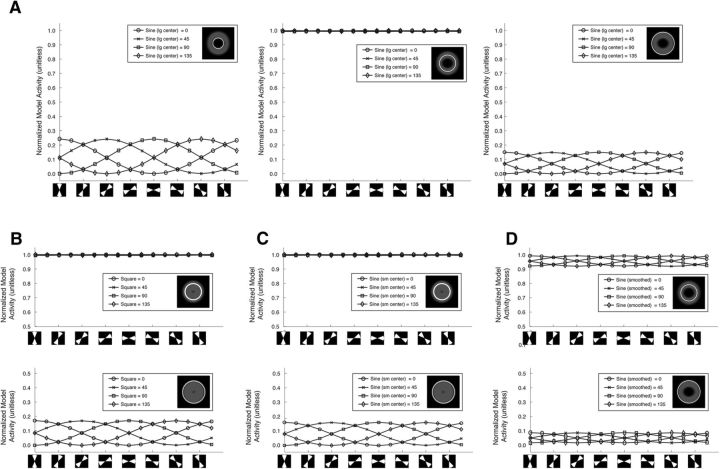
Figure 5.
Edge related activity mimics a radial bias. A, Mean activation of the PCM as a function of polar angle for 3 radiuses: the inner edge (left), the center of the annulus (middle), and the outer edge (right). The image in the inset of the legends graphically shows the radius. The x-axis is a defined double wedge region with a width of 45° that shifts stepwise in 22.5° steps (diagrammatically shown below the axis). The y-axis is the mean PCM activation within the defined region. The lines are different stimulus orientations. Activity was normalized collectively over the three radius conditions (inner edge, middle of the annulus, and outer edge) to range from 0 to 1 for the purposes of comparison. B–D, Mean activation of the PCM as a function of polar angle for two radiuses: the center of the annulus (top), and the outer edge (bottom) for the square-wave stimulus (B), the sine-wave grating stimuli with a small inner radius (C), and the heavily smoothed sine-wave grating stimuli with a large inner radius (D).

