
Figure 2.
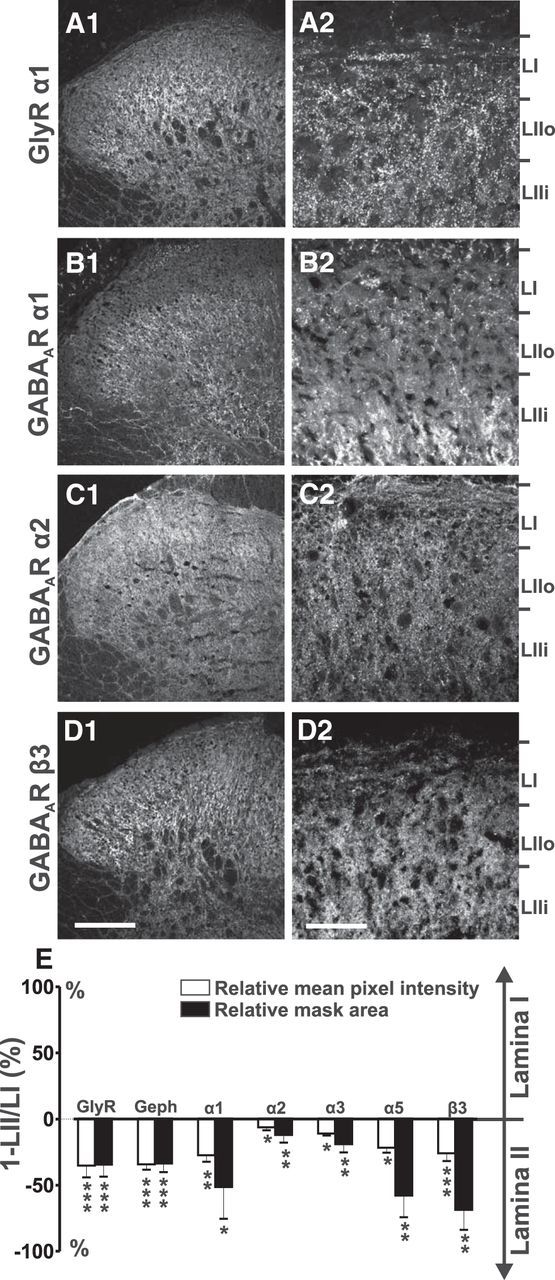
Laminar distribution of glycine and GABAA receptors in the rat superficial dorsal horn. Shown are images of spinal dorsal horn with immunostainings for the GlyR α1 subunit (A1, A2), the GABAA receptor α1 (B1, B2), α2 (C1, C2), and β3 (D1, D2) subunits. Limits of the superficial laminae were obtained based on their distance from the white matter and by comparison with the localization of the band of IB4 staining in the same optical section (data not shown), as described previously (Lorenzo et al., 2008). E, Quantification of the stainings in LI and LII. LIIi, Inner LII. Results are expressed in percentage difference (1-LII/LI) between LI and LII in the intensity and mask area for each staining. Positive values correspond to higher intensities or higher mask areas in LI, and negative values to higher intensities or higher mask areas in LII. *p < 0.05; **p < 0.01; ***p < 0.001. Data are expressed as mean ± SEM (as in all figures). For each subunit, the number of rats varied from n = 5 to n = 14. Scale bars, 175 μm (low magnification) and 40 μm (high magnification).