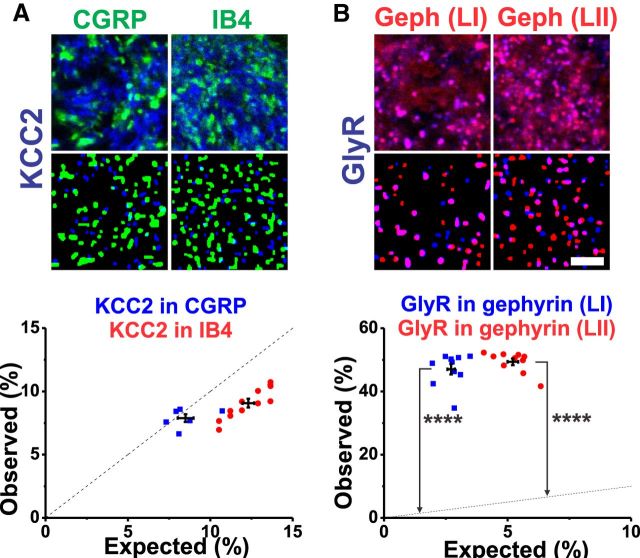
Figure 5.
Confirmation of the reliability of the colocalization analysis. Colocalization analysis as in Figure 4 (see also Materials and Methods) applied to labeling for KCC2 (A), known not to be expressed in primary afferents (Coull et al., 2003) and to labeling for GlyR α1 (B), known to highly associate with gephyrin clusters. ****p < 0.0001. For each marker, the numbers of rats were as follows: n = 6 for KCC2/CGRP, n = 12 for KCC2/IB4, and n = 10 for GlyR α1/gephyrin in LI and LII. Scale bar, 5 μm.

