Figure 7.
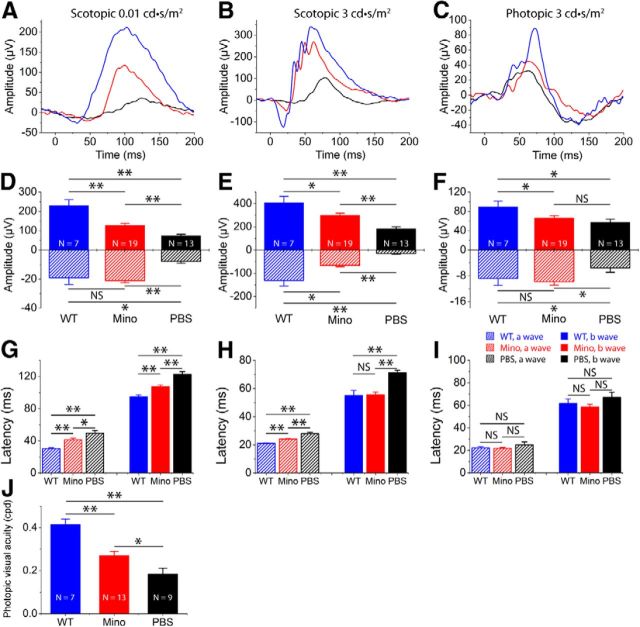
Functional preservation of photoreceptors by minocycline (Mino) treatment. A, B, Representative scotopic ERG responses to 0.01 and 3 cd-s/m2 light intensities from rd10 mice at P25 treated with minocycline (red curve) or PBS (dark curve) from P13 to P24. Scotopic ERG responses from C57BL/6 (blue curve) are shown as comparisons. D, E, Average scotopic a-wave and b-wave amplitudes elicited at 0.01cd-s/m2 (D) and 3 cd-s/m2 (E) light intensities from normal C57 BL/6 (blue), minocycline-treated (red), and PBS-treated (dark) rd10 eyes. Data are expressed as the mean ± SD. C, Representative photopic ERGs elicited at 3 cd-s/m2 light intensity from the same three groups of mice as scotopic recording. F, Averaged photopic a-wave and b-wave amplitudes elicited at 3 cd-s/m2 light intensity from normal C57 BL/6 (blue), minocycline-treated (red), and PBS-treated (dark) rd10 eyes. G–I, Average latency time (time to peak) for scotopic ERG a-waves and b-waves at 0.01cd-s/m2 (G) and 3 cd-s/m2 (H) light intensities, and for photopic ERG a-waves and b-waves at 3 cd-s/m2 (I). J, Photopic visual acuity measured by the optokinetic response. Values are means and SDs. n = animal numbers; *p < 0.05 and **p < 0.01.

