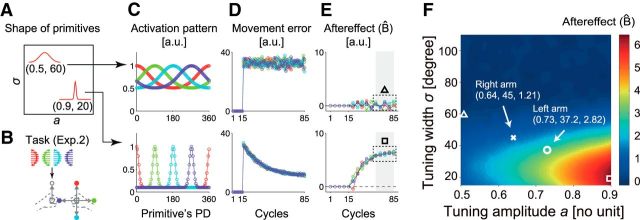
Figure 6.
Model prediction of Experiment 2. A, Shapes of two representative primitives from the simulation. B, Task setting of Experiment 2. C, Activity pattern of primitives. Each point indicates the activity level of each primitive with PD shown in the horizontal axis. Each color indicates the activity pattern corresponding to the movement direction of the opposite arm shown in B. D, Movement error. E, Aftereffect. Note that one cycle consists of four trials. F, The color code indicates the amount of the aftereffect averaged across the late phase of motor learning (i.e., the 11th to 15th error-clamped trials indicated by the shaded areas in E) obtained by simulations with various sets of parameters. Triangle and square indicate the data corresponding to the data shown in E.

