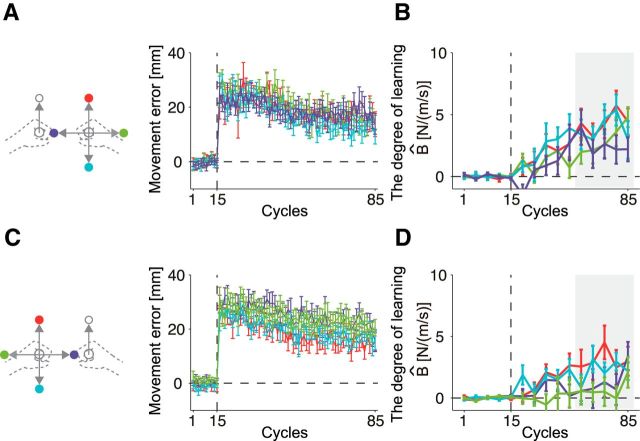
Figure 7.
Results of Experiment 2. A, B, Experimental data from the Group 1 (the left arm was trained). A, Movement error (lateral hand deviation at peak movement speed) plotted separately for each movement direction of the right arm. Each color corresponds to the movement direction of the opposite arm, as shown in the schematics on the left side of the panel. B, Aftereffect measured by error-clamped trials plotted separately for each movement direction of the right arm. Aftereffect data indicated by shaded area (11th–15th aftereffects) were submitted to subsequent statistical analysis. C, D, The same datasets from Group 2 (in which the right arm was trained) presented identically as in A and B.

