Figure 5.
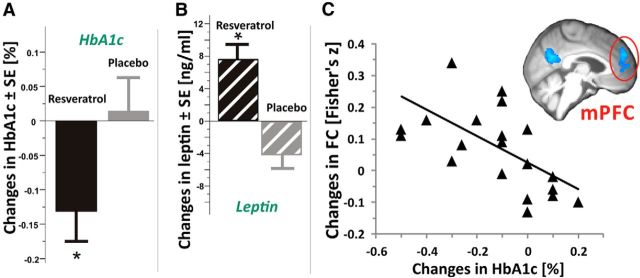
Changes in glycated HbA1c and leptin. A, Note the significant decrease in fasting HbA1c after resveratrol (black bar, n = 21) compared with placebo (gray bar, n = 21; p = 0.014). B, Leptin concentrations significantly increased after resveratrol (black striped bar, n = 23) and decreased after placebo (gray striped bar; n = 23). C, In the resveratrol group, decreases in HbA1c correlated significantly with increases in FC (n = 21; r = 0.4, p = 0.04). Triangles show median changes in FC within a significant cluster in the left medial prefrontal cortex (outlined in red, see inset; for details, see Fig. 3) using the left posterior hippocampus as seed in relation to changes in HbA1c. Line indicates regression fit. *p < 0.05, paired t test.

