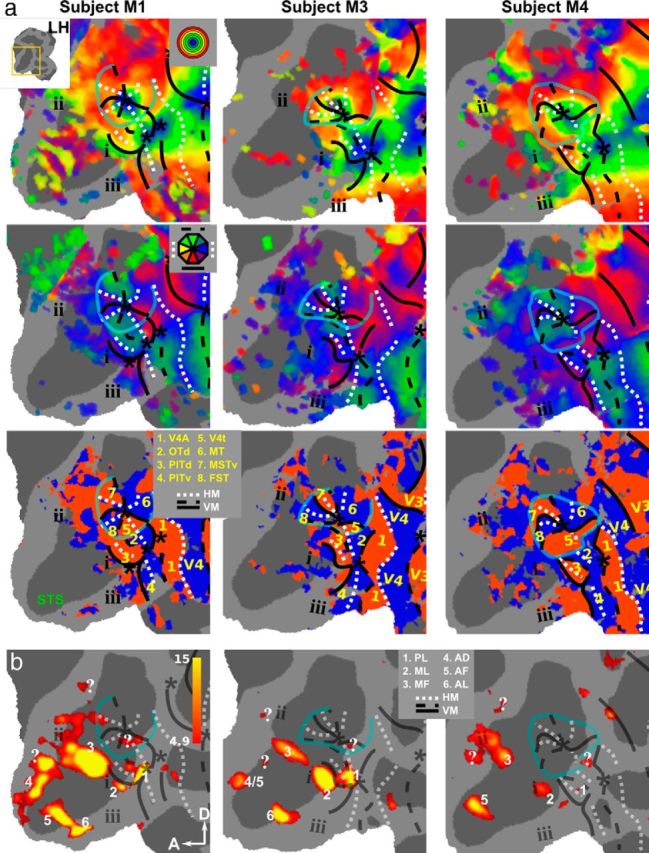
Figure 4.

Retinotopic maps and face patches in occipitotemporal cortex of the left hemisphere. The results for the left hemispheres of subjects M1, M3, and M4 are shown on a flattened map zoomed in on the STS. a, Eccentricity (top), polar-angle (middle), and field-sign (bottom) maps. b, t score maps for the contrast monkey face versus size-matched objects thresholded at p < 0.05, FWE corrected. See Figures 2 and 3 for nomenclature.
