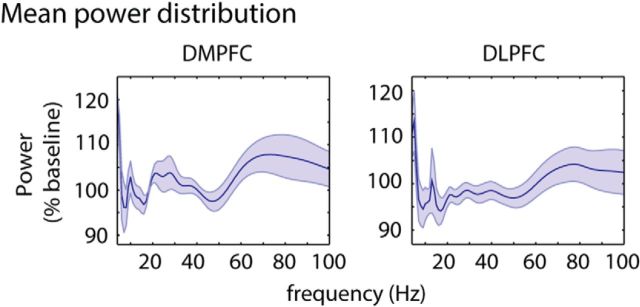
Figure 3.
Frequency-specific power distribution in the DMPFC and DLPFC. Plots represent mean power ± SEM values across patients. Within each patient, values had been averaged across all time points (1500 ms intertrial interval, 3000 ms trial period), trials, tasks (semantic task, phonetic task), and stimuli (inconsistent, consistent, control).

