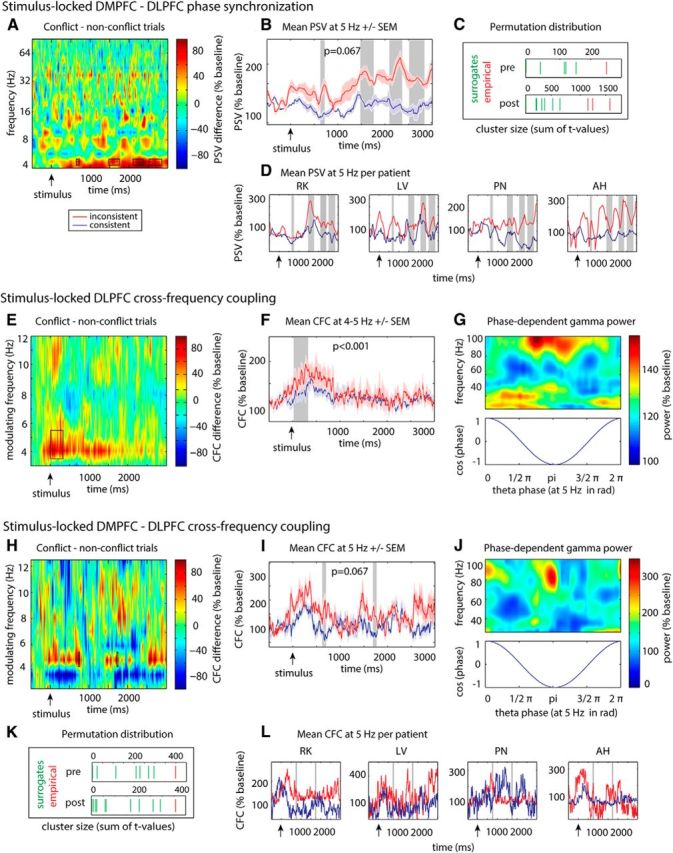
Figure 7.

Conflict-related changes in CFC within the DLPFC and phase synchronization and CFC between DMPFC and DLPFC. Significant clusters are highlighted, and the location of the observed test statistic (red) within the surrogate distribution (green) is shown for all analyses with n = 4 patients and n = 15 possible surrogate permutations (C, K; cluster size as sum of t values). When <15 clusters are indicated, the remaining permutations did not reveal any significant clusters. A, B, D, Time-frequency plots of DMPFC-DLPFC PSVs during conflict processing (conflict vs nonconflict trials). Conflict was associated with synchronization increases at 5 Hz before and after average response latency (highlighted). E–G, Intraregional CFC within the DLPFC during conflict compared with nonconflict trials. During conflict, early DLPFC γ power was transiently locked to DLPFC θ phases. E, Time-dependent magnitude of the modulation of γ power by low-frequency phases. F, Time-dependent CFC at 5 Hz, where significant conflict-associated changes had been found. G, DLPFC γ power during conflict trials as a function of low-frequency phases within the significant time window. H–J, L, Conflict-related increase in inter-regional CFC between DMPFC θ phase and DLPFC γ power before and after average response latency.
