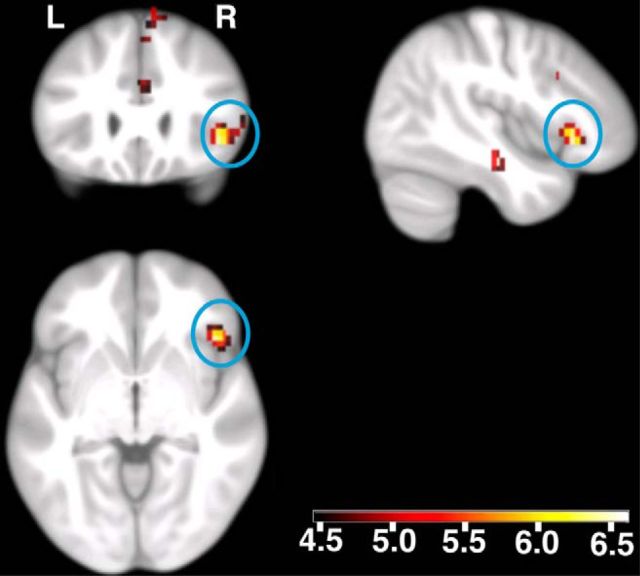
Figure 4.
Methylation-dependent differences in brain activity related to successful recognition of previously seen pictures in healthy men. Displayed are voxels with a positive correlation between methylation values (at NR3C1_CpG3) and activity, using color-coded t values. The blue circles show the activation in the pars triangularis and pars orbitalis of the inferior frontal gyrus (centered at 44, 25, −4; peak pFWE corrected < 0.05; displayed at puncorrected < 0.001; a random-effects, linear-regression model). Activations are overlaid on coronal (upper left), sagittal (upper right), and axial sections of the study-specific group template (see main text). L, Left side of the brain; R, right side of the brain.

