
Figure 1.
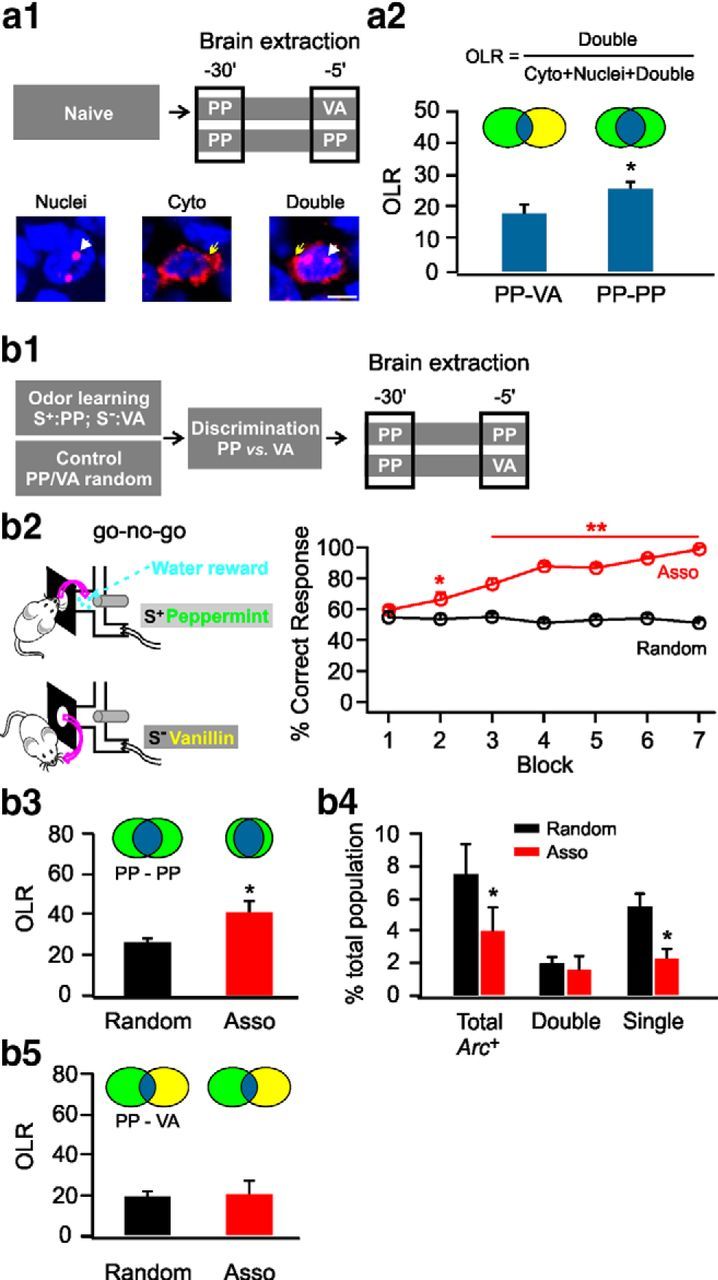
Contrast enhancement after odor associative learning. a1, Schematic of brain extraction protocol in naive rats (top) and example images for Arc+ cells (bottom). Blue indicates nuclei staining by DAPI. Red indicates Arc staining. White arrows indicate Arc staining in nuclei. Yellow arrows indicate Arc cytoplasm staining. Scale bar, 10 μm. a2, Overlap ratios (OLRs) of the cell ensembles of the two odor episodes. Cyto, cytoplasmic; PP, peppermint; VA, vanillin. b1, Schematic of odor associative training and brain extraction protocol. b2, Go–no-go behavioral paradigm (left) and percentage correct responses in the associative (Asso) group and the random group (right). b3, OLRs of the cell ensembles representing two peppermint episodes. b4, Percentage Arc+ cells over the number of total cells measured by DAPI staining. b5, OLRs of the cell ensembles representing two different odor episodes (peppermint and vanillin). *p < 0.05, **p < 0.01.