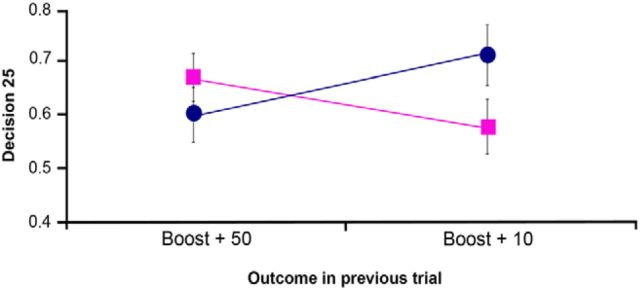
Figure 2.
Behavioral results. The relationship between outcome in the previous trial (unexpected high wins vs unexpected low wins) and the probability of making a risky choice (choosing 25) are shown for the nonapathetic (square) and apathetic (circle) patient groups. A significant interaction was found between magnitude of the gain in the boost trial and patient group (F(1,38) = 11.18, p = 0.002). Error bars indicate SEM.

