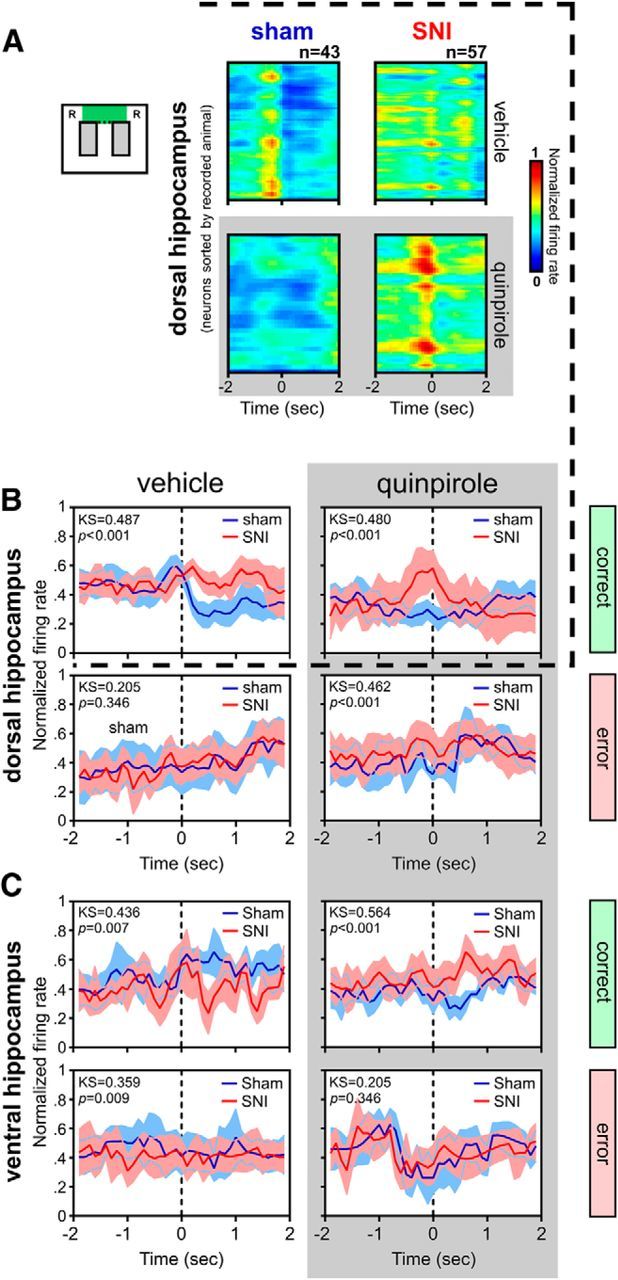
Figure 3.

Peridecision neuronal activity during correct and error trials. A, Color-coded raster plots of neuronal activity (bin resolution of 50 ms) for all dorsal hippocampus recorded neurons during the 4 s period centered in the moment of crossing from the delay to the choice area in the figure-8 maze during correct trials. dCA1 neurons of sham animals present a peak of neuronal firing rate immediately preceding the approach of the decision point that is followed by a sudden decrease in firing rate. In contrast, dCA1 neurons of SNI animals show a more stable firing rate during the peridecision period. Injection of quinpirole reverses this electrophysiological pattern, with the SNI animals now presenting a peak of activity and sham animals showing a stable firing rate. B, C, Detailed peridecision histograms of population neuronal activity for both dorsal (B) and ventral (C) hippocampus during either correct (top) or error (bottom) trials. Values are presented as mean ± SEM. Comparisons of firing distributions of experimental groups are based on the KS2 test; p < 0.05.
