Figure 4.

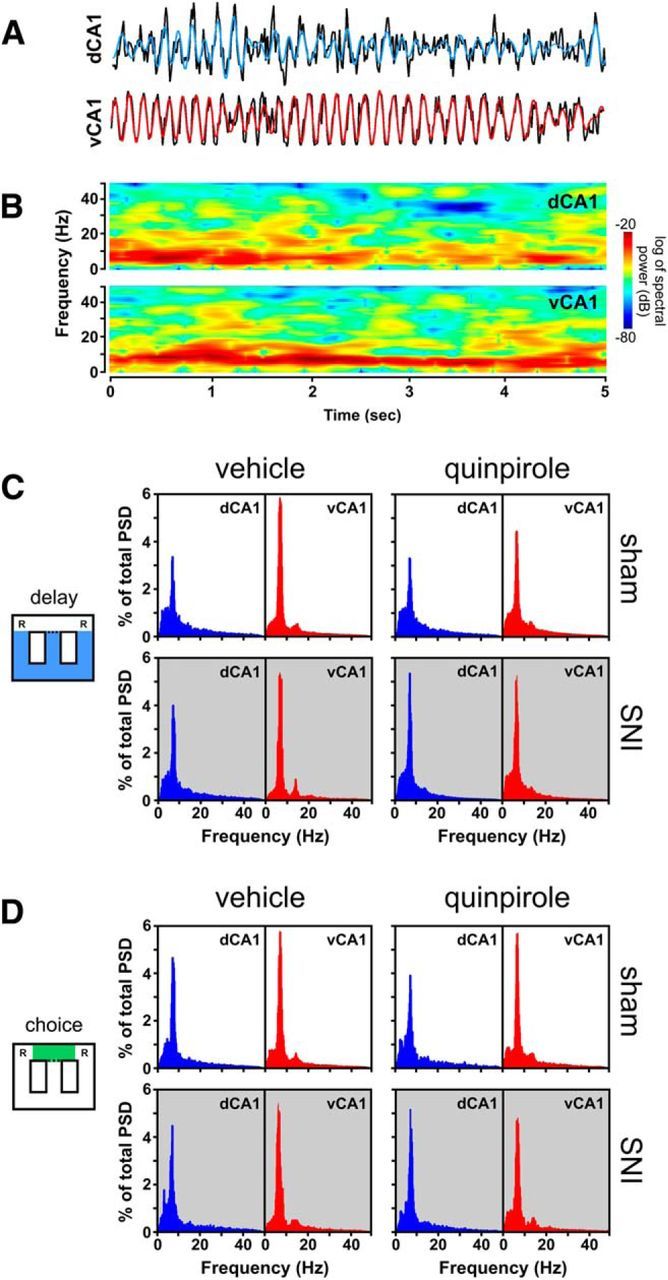
Spectral analysis of dorsal and ventral CA1 hippocampus LFP signals. A, Example trace of raw recording representing 5 s of ongoing LFP activity in a sham animal recorded during delay zone navigation. Blue trace represent the dorsal hippocampus θ filtered signal (4–9 Hz), whereas the red trace represent the ventral hippocampus θ filtered signal (4–9 Hz); the black traces undern each colored trace are the unfiltered LFP signal of each area. B, Full spectrograms for the same example of 5 s recording used in A show the predominance of θ oscillations in both areas of the hippocampus during active navigation. C, D, Power spectra density plots of dorsal and ventral LFP activity during navigation in the delay zone (C) and choice zone (D) for both sham (n = 4) and SNI (n = 7) animals. Data were calculated for each entire recording session independently of correct or error trials. PSD traces show that quinpirole does not affect the overall pattern of θ predominance.
