Figure 6.
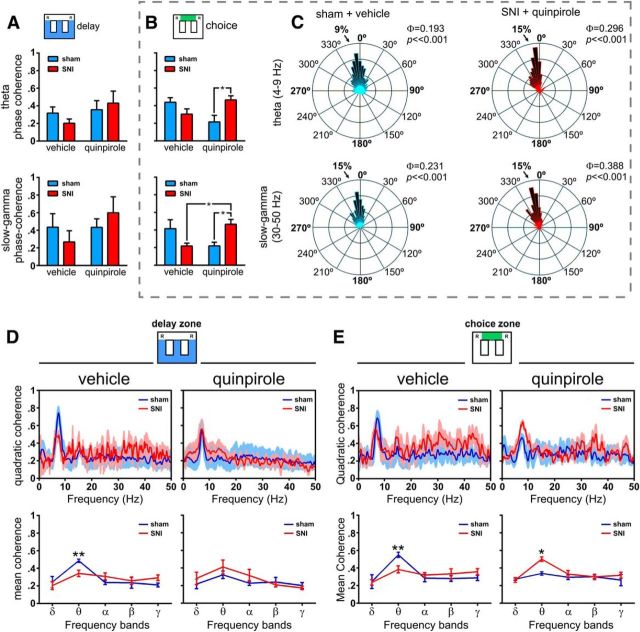
Spectral analysis of θ and γ LFP activity in dorsal and ventral hippocampus during maze navigation. A, B, dCA1-vCA1 phase coherence (Φ) activity for θ (4–9 Hz) and γ (30–50 Hz) frequency bands during delay and choice zones navigation. No significant differences were observed in delay zone between experimental groups or quinpirole administration (A). In contrast, during choice zone navigation (B), quinpirole reversed the phase coherence between sham and SNI animals in both the θ and γ bands of frequency. C, Examples of rose plots of LFP phase distributions after vehicle (in a sham animal) and quinpirole (in an SNI animal). The number in the upper right corner of each rose plot represents the value of Φ. All circular concentration distributions are significantly nonuniform (Rayleigh test, p < 0.01). D, E, Spectral quadratic coherence between CA1 and vCA1 LFP signals show in all cases a strong coherence in the θ band of frequency (top). Detailed analysis of the quadratic coherence per band of frequency (bottom) shows that sham animals in both areas of maze have the largest θ quadratic coherence, whereas after quinpirole, the maximal θ coherence occurs in the SNI animals. Frequency bands: δ, 1–4 Hz; θ, 4–9 Hz; α, 9–15 Hz; β, 15–30 Hz; γ, 30–50 Hz. Values are presented as mean ± SEM. Comparisons between experimental groups are based on two-way ANOVA (group × treatment) or (group × frequency band), followed by post hoc Bonferroni. *p < 0.05; **p < 0.01.

