Figure 5.
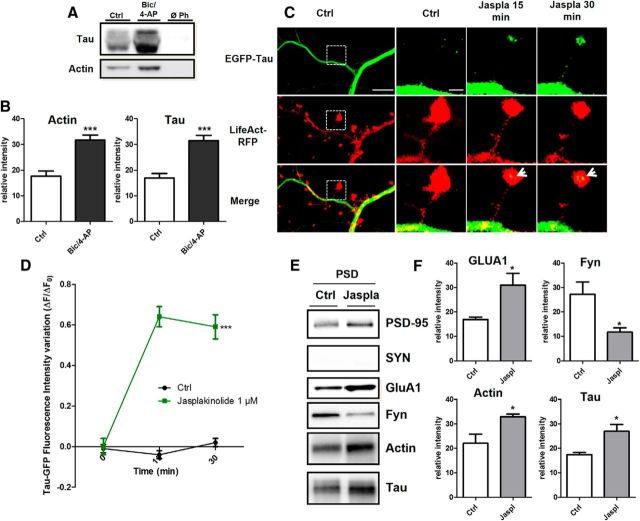
Tau interacts with F-actin in the synaptic compartment. A, Representative Western blot showing F-actin-associated tau in cultured cortical neurons treated for 15 min with Bic/4-AP. Cell lysate was collected after treatment and F-actin precipitated with phalloidin as described in the Materials and Methods. B, Quantifications of actin and tau in control and Bic/4-AP condition (mean ± SEM, 2-tailed Student's t test, ***p < 0.001, N = 7 independent cultures). C, Confocal imaging of cortical neurons (14 DIV) cotransfected with EGFP-Tau and LifeAct-RFP treated with jasplakinolide (1 μm), a specific agent that stabilizes F-actin. Left, Cropped view of dendritic branch of transfected neuron under control condition. Scale bar, 5 μm. Right, Higher magnification of EGFP-Tau and LifeAct-RFP in dendritic spines (cropped view of dotted box in the left) of neuron before and 15 and 30 min after jasplakinolide (1 μm) treatment. The merged image shows colocalization of EGFP-Tau and LifeAct-RFP (white arrows). Scale bar, 1 μm. D, Quantification of the fluorescence intensity variation (ΔF/F0) of EGFP-Tau in the head of spines during actin network stabilization (jasplakinolide treatment). Statistical analysis was performed by two-way ANOVA followed by Bonferroni's posttest (mean ± SEM, ***p < 0.0001, control n = 40, N = 3 independent cultures, jasplakinolide n = 106, N = 4 independent cultures). E, Representative Western blots of protein expression from PSD-enriched fraction primary cortical cultures treated or not with jasplakinolide (1 μm, synaptophysin [SYN], PSD-95, GluA1, Fyn actin, and tau in PSD-fraction (Triton-insoluble fraction)). F, Quantitative analysis of Western blots of PSD-95, GluA1, actin, and tau in PSD fraction (mean ± SEM, 2-tailed Student's t test, **p < 0.01, *p < 0.05, N = 4 independent cultures).

