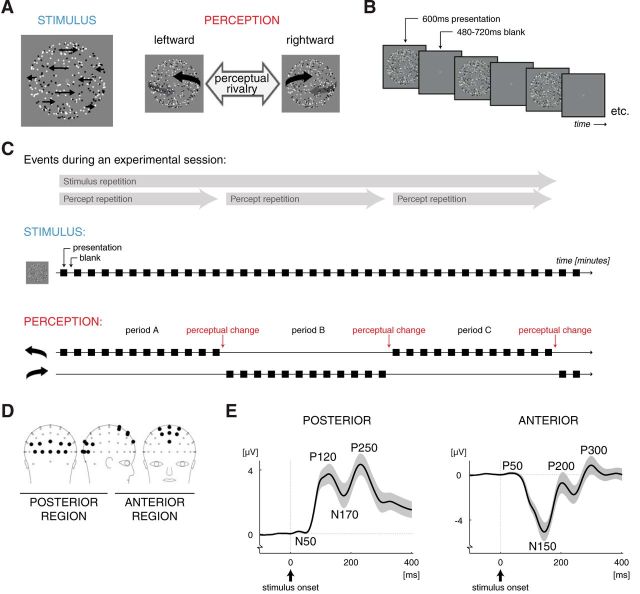
Figure 1.
Stimuli and paradigm. A, The ambiguous 3D motion stimulus. The horizontal speed of the dots was faster near the vertical meridian than near the left and right edges (indicated by the length of the black arrows). This provided an ambiguous depth cue (structure-from-motion without stereoscopic disparity): either the leftward or the rightward moving dots were perceived as the front surface of a rotating globe. The occurrence of different perceptual interpretations of the same stimulus enabled us to dissociate the neural effects of stimulus repetition from those of percept repetition. B, The intermittent presentation paradigm. Each presentation consisted of a 600 ms presentation of the stimulus followed by a blank period lasting 480–720 ms. Observers tend to experience the same percept consecutively for many presentations when such short-lasting presentations of an ambiguous stimulus are interleaved with blank intervals. In the present study, a change in perception occurred occasionally (ones every several minutes), which then indicated the end of the current perceptually stable period and the start of the next period, during which the other percept was experienced. C, Schematic drawing of the events during an experimental session. The ambiguous stimulus was the same throughout the session, but the conscious perception of the stimulus changed from one perceptually stable period to the next. For illustration purposes, a limited amount of stimulus presentations is drawn in each period. The actual number of presentations amounted on average up to 229 per period (lasting 4.6 min) but could vary between periods and participants as it was determined by the reported perceptual time course. An experimental session consisted of repeated presentation of the ambiguous rotating globe and lasted until three consecutive perceptually stable periods were completed (referred to as periods A, B, and C, respectively). For our data analysis, we divided each period into four quartiles that each contained 25% of the presentations of that period. We hypothesized that the neural response, as measured with EEG, is concurrently modified by both stimulus repetition (across periods) and percept repetition (within periods; across quartiles). These effects are presented in blue and red colors, respectively, in this and the subsequent figures. D, Topographical map of the scalp locations of the electrodes in the posterior (on the left) and anterior (on the right) region of interest (see filled circles; other electrodes are shown as open circles). E, Grand mean waveform of ERPs derived from EEGs over the posterior (on the left) and anterior (on the right) regions of interest (n = 17; shading indicates ±1 SEM). Peaks in the ERPs are named according to their polarity and timing: P and N indicate positive and negative deflections, respectively, and the number indicates the approximate stimulus-onset-to-peak latency in milliseconds. In the literature, the posterior N50, P120, and N170 are often referred to as the visually evoked “C1,” “P1,” and “N1,” respectively.

