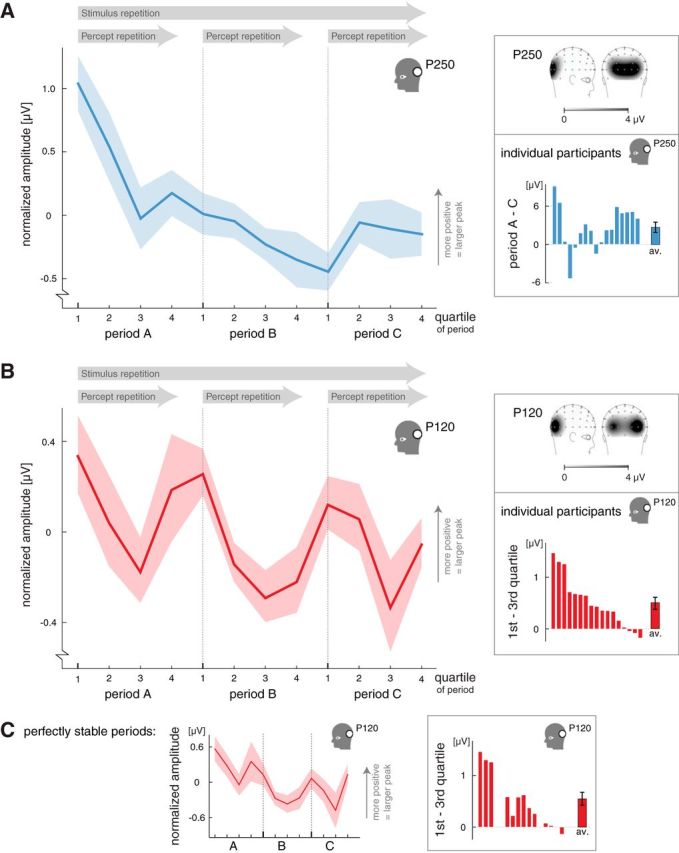
Figure 2.

The influence of stimulus repetition and percept repetition on peak values in the posterior region of interest. A, The influence of stimulus repetition on the amplitude of the posterior P250 peak. During an experimental session, the amplitude gradually decreased over time, regardless of the experienced percept (i.e., regardless of the changes in perception between the 3 perceptually stable periods that constituted a session; see Fig. 1C; n = 17; shading indicates ±1 SEM). The right top inset shows the topographical map of the P250 peak (EEG signal measured over the scalp between 200 and 250 ms after stimulus onset; darker shades indicate more positive amplitude; n = 17). The bottom inset shows the difference in P250 amplitude between periods A and C (averaged across quartiles) for individual participants. B, The influence of percept repetition on the amplitude of the posterior P120 peak. Within each perceptually stable period, the amplitude decreased from the first to third quartiles and slightly recovered from the third to fourth quartiles (n = 17; shading indicates ±1 SEM). This fall-and-rise pattern of the P120 amplitude was present within each period and resulted in an oscillating pattern across periods. Because this modulation developed within rather than across periods, we contribute it to percept repetition and not to stimulus repetition. The data thus reflect an early peak in the ERP, occurring ∼120 ms after stimulus onset, whose amplitude is modulated across many stimulus presentations, constituting an oscillatory pattern over the course of many minutes. Importantly, this oscillatory pattern developed relative to the perceptual time course rather than relative to real time or the absolute amount of stimulus presentations, given that the perceptually stable periods (and thus the quartiles) contained varying absolute numbers of stimulus presentations. The right top inset shows the topographical map of the P120 peak (EEG signal measured over the scalp between 100 and 150 ms after stimulus onset; darker shades indicate more positive amplitude; n = 17). The bottom inset shows the difference in P120 amplitude between the first and third quartiles for individual participants, averaged across periods A, B, and C. The order in which the participants are depicted is the same as in the bottom inset of A. C, The influence of percept repetition on the amplitude of the posterior P120 peak when the analysis included the perfectly stable periods only (0 reports of the nonstabilized percept; n = 12; shading indicates ±1 SEM). A fall-and-rise pattern occurred within each period, similar to the graph presented in B, suggesting that the recovery in P120 amplitude from the third to fourth quartiles was not related to the sporadic occurrence of the nonstabilized percept in quartile 4. The inset on the right shows the difference in P120 amplitude between the first and third quartiles for individual participants, averaged across periods A, B, and C (perfectly stable periods only; same order of participants as the bottom insets of A and B).
