
Figure 1.
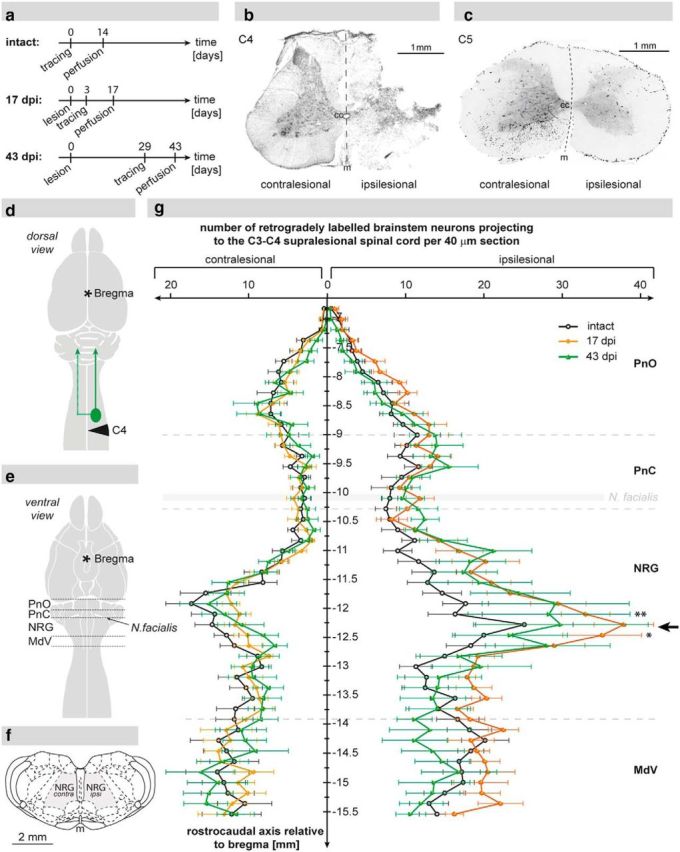
Reticulospinal projections to the ipsilesional C3–C4 spinal cord as shown by retrograde tracing. a, Experimental design displaying the time points of retrograde neuroanatomical tracing of the ipsilesional spinal segments C3–C4 and the time points of death of animals in the intact group (n = 6), the 17 d post injury (dpi) group (n = 8), and the 43 dpi group (n = 6). b, Analysis of lesion completeness: representative Nissl-stained spinal cord cross-section showing a complete right-sided C4 unilateral hemisection. c, C5 spinal cross-section of the same animal depicting the absence of labeled fibers (color-inverted) in the ipsilesional white matter below the lesion. d, Scheme displaying the lesion site (black triangle), the location of tracer injection (green circle), and the route of retrograde tracer transport (green arrows). e, Illustration showing the ventral view of the CNS with the regions of the reticular formation analyzed in the retrograde cell count: oral pons (PnO), caudal pons (PnC), nucleus reticularis gigantocellularis (NRG), and medullary reticular nucleus pars ventralis (MdV). f, Schematic view of a coronal brainstem section displaying the reticular column (gray area) at the level of the NRG. g, Quantification of retrogradely labeled neurons within the reticular formation of intact animals (n = 6; black), animals 17 dpi (n = 8; orange), and animals 43 dpi (n = 6; green) per 40 μm coronal brain section. Cell counts on the contralesional side were unchanged after injury, whereas the number of labeled NRG neurons on the ipsilesional side was significantly elevated 17 dpi and remained increased until 43 dpi (black arrow). Data are group mean values ± SEM. Data were analyzed by two-way repeated-measures ANOVA followed by post hoc Bonferroni's multiple-comparison test. *p < 0.05. **p < 0.01; cc, central canal; m, midline.