
Figure 2.
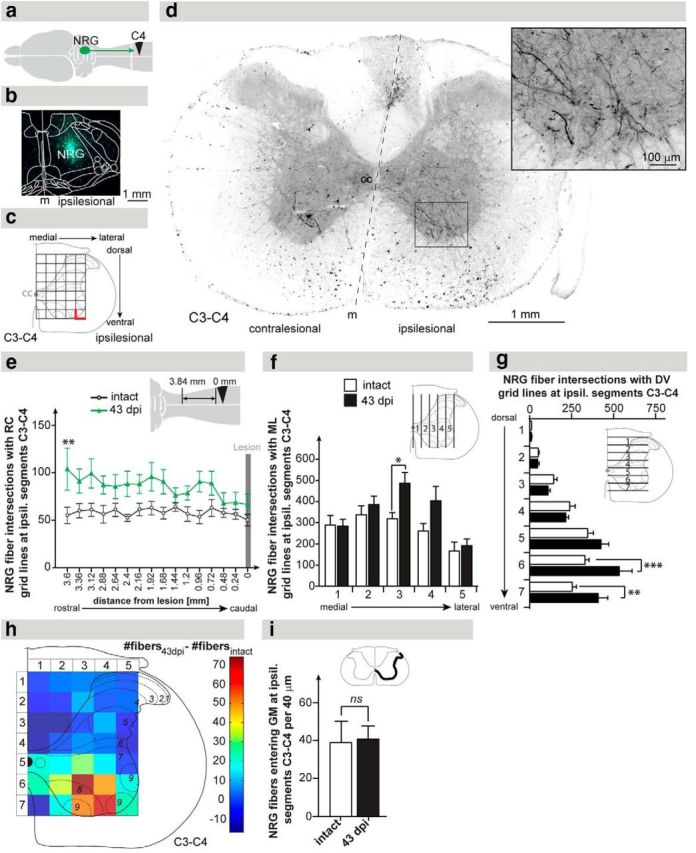
Anterograde tracing of reticulospinal fibers originating from the ipsilesional NRG. a, Schematic illustration showing the site of anterograde tracer injection (ipsilesional NRG), the anterograde tracer transport, and the lesion site. b, Representative injection site of the tracer ME in the ipsilesional NRG. c, Scheme displaying the 5 × 7 grid used for stereological quantification of reticulospinal fiber density at the ipsilesional C3–C4 spinal cord. Intersections of axons with the medial and ventral lines (bold red lines) of each rectangle were defined as fiber counts. d, Representative C3–C4 cross-section showing labeled descending NRG fibers at 43 dpi primarily in the ventromedial and ventral funiculi of the ipsilateral white matter innervating the ventral horn of the gray matter (inset). e, Quantification of gigantocellular fibers along the rostrocaudal (RC) axis in the ipsilesional C3–C4 gray matter. Fiber counts were augmented 43 dpi (green line) compared with intact animals (gray line). f, Quantification of reticulospinal fibers along the mediolateral axis in the ipsilesional C3–C4 gray matter. Fiber counts were specifically increased in the central part of the gray matter 43 dpi (black bars) compared with intact animals (white bars). g, Quantification of NRG fibers along the dorsoventral axis in the ipsilesional C3–C4 gray matter. Fiber counts were specifically increased in the most ventral gray matter 43 dpi compared with intact animals. h, Heat plot illustrating the difference in fiber counts between 43 dpi and the intact situation. NRG fiber density was primarily increased in the ventromedial gray matter of the ipsilesional segments C3–C4. i, Collaterals of descending NRG fibers per 40 μm cross-section entering the spinal gray matter (GM) at ipsilesional spinal segments C3–C4. Fiber counts were not different in animals 43 dpi and intact animals. Data points (e) and bars (f, g, i) represent group mean values ± SEM. Analysis of groups was performed by two-way repeated-measures ANOVA followed by post hoc Bonferroni's multiple-comparison test. Comparison of total mean values between intact and 43 dpi was performed by the unpaired, two-tailed Student's t test. *p < 0.05. **p < 0.01. cc, central canal; contral, contralesional; m, midline; ipsil, ipsilesional; ns, not significant.