Figure 4.

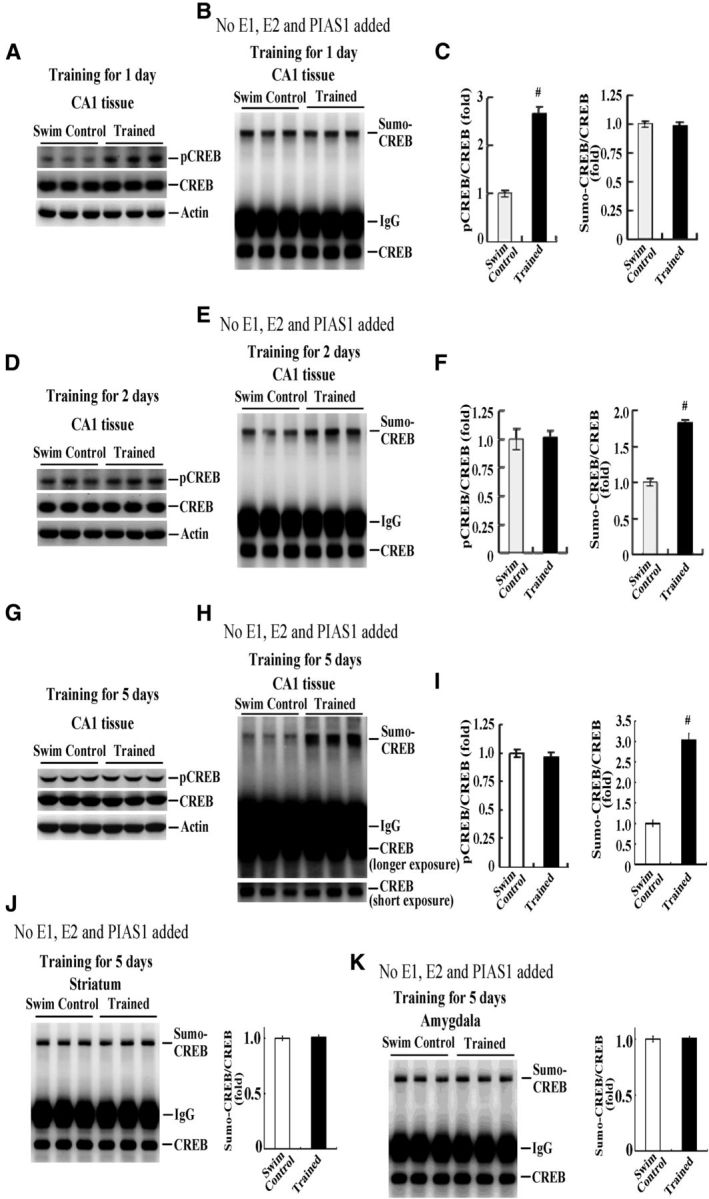
Time course change of CREB phosphorylation and CREB SUMOylation in rat hippocampus. Naive rats were randomly assigned to the swim control group or subjected to spatial training for 1 d and their CA1 tissue was dissected out for determination of CREB phosphorylation (A) and endogenous CREB SUMOylation (B). The quantified results are shown in C. Separate groups of animals were divided into the swim control group or subjected to spatial training for 2 d and their CA1 tissue was dissected out for determination of CREB phosphorylation (D) and endogenous CREB SUMOylation (E). The quantified results are shown in F. Two other groups of animals were divided into the swim control group or subjected to spatial training for 5 d and their CA1 tissue was dissected out for determination of CREB phosphorylation (G) and endogenous CREB SUMOylation (H). The quantified results are shown in I. Endogenous CREB SUMOylation in the striatum (J) and amygdala (K) from the same animals (trained for 5 d) and the quantified results are shown. n = 5 each group. Data are expressed as mean ± SEM. #p < 0.001.
