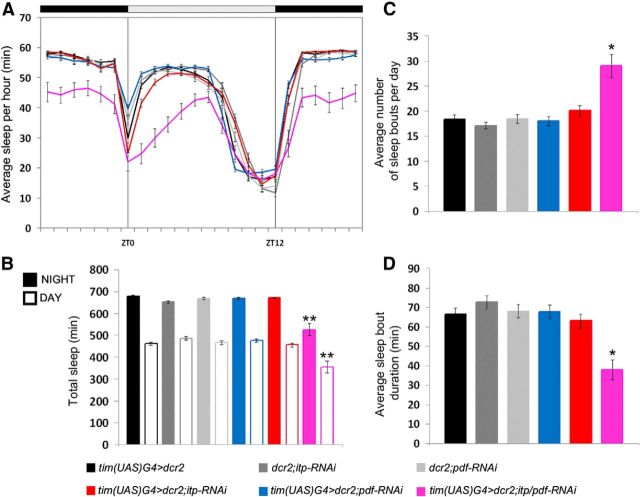
Figure 11.
Sleep parameters of ITP/PDF-double-KD flies, ITP-KD, and PDF-single-KD flies and controls in LD 12:12. Sleep was defined as the average amount of time in which the flies did not cross the infrared light beam for at least 5 consecutive minutes. A, Daily average sleep profiles of ITP-KD flies (red), PDF-KD flies (blue), ITP/PDF-double-KD flies (magenta), and controls (different grays). ITP-KD flies do not show any differences in the sleep profile compared with controls. ITP/PDF-double-KD flies clearly sleep less during the night and during the first half of the day. B, Total amount of sleep during nighttime (full bars) and daytime (empty bars). ITP-KD flies do not differ from controls in total sleep. ITP/PDF-double-KD flies show significantly decreased nighttime and daytime sleep compared with all other genotypes. C, Average number of sleep bouts per day was increased in ITP/PDF-double-KD flies. D, ITP/PDF-double-KD flies show, on average, significantly shorter sleeping bouts than all other genotypes. *p < 0.05; **p < 0.001. Error bars indicate SEM. n ≥ 21 in all panels.

