Figure 2.

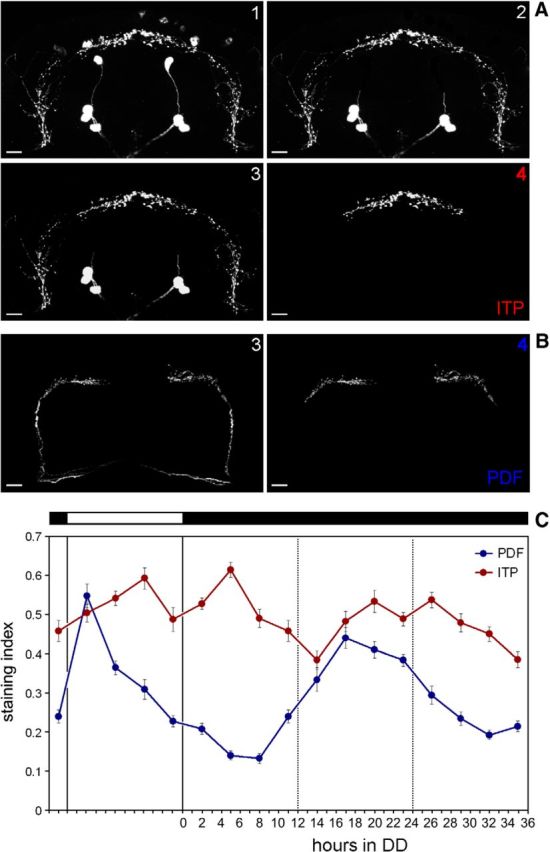
Exact manipulation of the pictures to determine staining intensity and ITP/PDF cycling in DD. A, Manipulation of the ITP fibers for quantification of staining intensity in the terminals is indicated in pictures 1–4. Picture 1 represents the original picture obtained from overlaying 20 confocal sections (of 2 μm thickness). In Picture 2, the cell bodies of the ipc-1, ipc-2, and ipc-4 neurons that were close to the ITP terminals in the PI were removed manually with the erase tool of Corel Photopaint. In few cases, single ipc-1 or ipc-4 neurons were located directly on the varicosities of the ITP terminals (left brain hemisphere). Their removal left a black spot in the varicosities, but because this happened at the same frequency in all samples, we assume that the overall results were not affected. Next (picture 3), the background was set to zero by adjusting brightness of the picture (in Corel Photopaint). In picture 4, the ITP fibers were cut so that only the ITP fibers in the median brain were left (see also Fig. 1C). This picture was used to calculate average pixel intensity of the entire picture. B, Manipulation of the PDF fibers for quantification. As for ITP 20, confocal sections were combined, the background was set to zero (picture 3), and finally the PDF fibers were cut at their characteristic first bend toward the median dorsal protocerebrum (picture 4). C, Quantification of ITP and PDF terminals for the first day under DD. For details, see text. n ≥ 10 per time point. Error bars indicate SEM. Scale bars, 10 μm.
