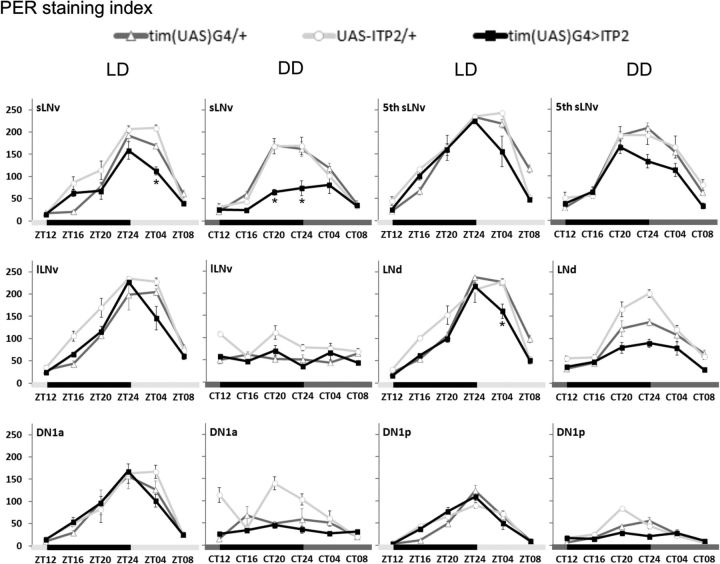
Figure 8.
PER staining intensity in clock neurons in LD 12:12 and DD in ITP-overexpressing flies and controls. Adult male brains were stained with anti-PER after entrainment to LD 12:12 (100 lux, 20°C). Flies were collected at different ZTs in LD 12:12 and at different CTs on the third day in DD. CTs indicate the time points when the light would have been on or off with respect to the previous LD cycle. Staining intensity in different clock neuron clusters was quantified in at least 5 brains per time point (n ≥ 5). PER cycling in behaviorally arrhythmic ITP-overexpressing flies (tim(UAS)G4>ITP2; black) was reduced in amplitude (PER levels at ZT04) in the sLNv and the LNd compared with control strains (light and dark gray) in LD. In DD, PER protein was still clearly cycling in sLNv, fifth sLNv, and LNd in both control flies and ITP-overexpressing flies. In the latter genotype, the amplitude of the oscillations (PER level at CT20 or CT24) was, however, again significantly reduced in the sLNv and the LNd, although the difference in the LNd was just above the significance level. Black and light gray bars indicate the LD light regime; black and dark gray bars indicate subjective night and day in DD. Error bars indicate SEM. *Significant differences (p < 0.05) in PER levels between the experimental strain and both controls at the respective time points.

