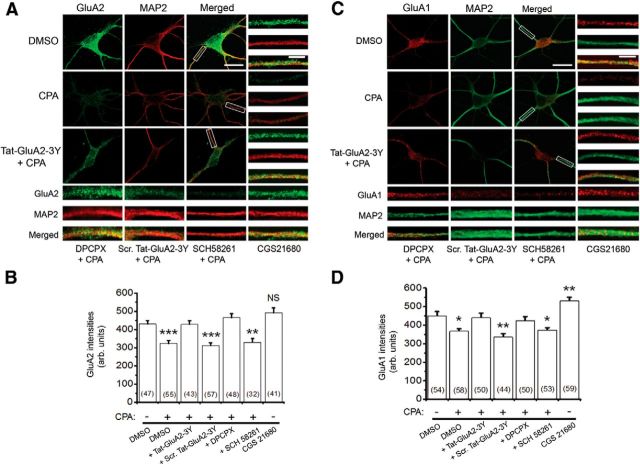
Figure 5.
AMPAR surface levels were decreased by activation of A1Rs with CPA. A, Confocal imaging of surface GluA2 (green) in primary hippocampal neurons. GluA2 receptors were first labeled without membrane permeabilization, and subsequent immunolabeling of MAP2 was performed after permeabilization with 0.25% Triton X-100. These images show that most dendritic processes, when exposed to prolonged A1R agonist CPA (500 nm), demonstrate reduced surface GluA2, whereas preincubation of hippocampal neurons with Tat-GluA2–3Y (2 μm) peptide prevented activation of A1R-induced GluA2 internalization. B, Summary bar chart showing that activation of A1R-induced GluA2 internalization requires clathrin-mediated endocytosis (shown with Tat-GluA2–3Y) and functional A1Rs (shown with DPCPX, 100 nm). The A2A receptor antagonist, SCH 58261 (30 nm), did not prevent activation of A1R-induced GluA2 internalization, whereas the A2AR agonist CGS 21680 (10 nm) did not mimic the effect of CPA. C, D, Similar to GluA2, the surface GluA1 levels were decreased by activation of A1R (with CPA). C, Representative confocal images show that CPA decreased surface levels of GluA1 (red), but not in the presence of Tat-GluA2–3Y peptide or DPCPX. D, Summary bar chart showing that activation of A1Rs induced surface GluA1 internalization, which was prevented by Tat-GluA2–3Y peptide and DPCPX, but not by scrambled Tat-GluA2–3Y peptide and SCH 58261. However, CGS 21680 significantly increased surface levels of GluA1. Average intensity values in bars represent the mean ± SEM, and n values of the number of neurons used are indicated in the bar charts. *p < 0.05 (one-way ANOVA, followed by post hoc Student-Newman-Keuls test). **p < 0.01 (one-way ANOVA, followed by post hoc Student-Newman-Keuls test). ***p < 0001 (one-way ANOVA, followed by post hoc Student-Newman-Keuls test). NS, Not significant (p > 0.05).

